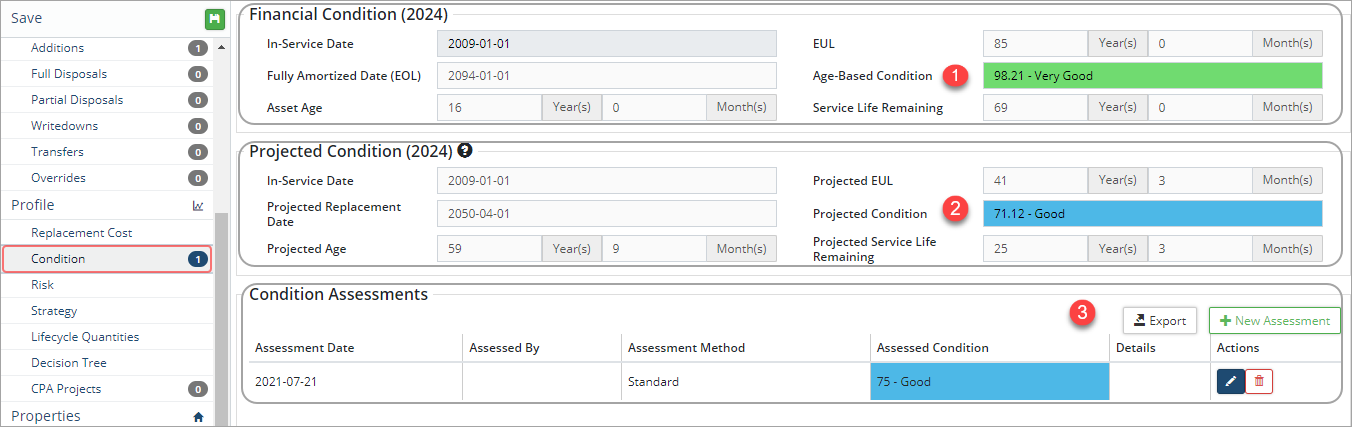
An asset's condition information can be viewed on both the Summary and Condition screens within the asset view. Users can customize the Inventory view grid to show age-based condition or projected condition information. Age-based condition is calculated using the in-service-date and EUL of the asset. The system calculates an Asset Age and Service Life Remaining which is shown relative to the reporting year set for the database. Projected condition is based on the most recent condition assessment entered on the asset. The system will calculate a Projected Age and Projected Service Life Remaining relative to the reporting year.
Condition assessments are added on the asset using the +New Assessment button or in bulk using the Upload Center/Asset Sync template.
- Click Condition In the asset view.
- Click +New Assessment .
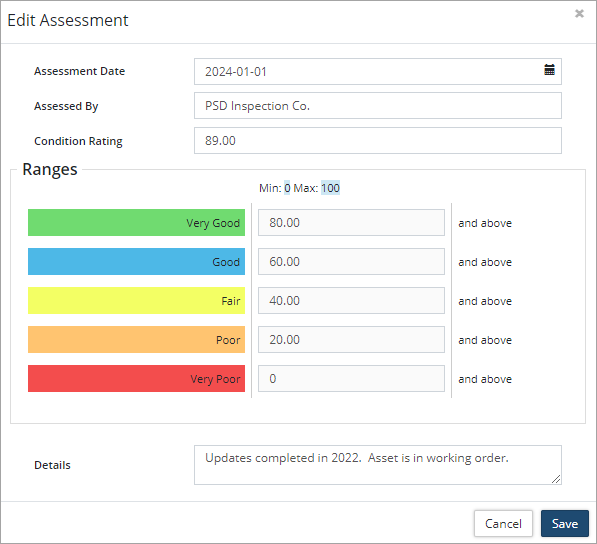
- Enter the Assessment Date (YYYY-MM-DD).
- Enter who completed the assessment in the Assessed By field.
- Enter the Condition Rating. which should correspond with the condition Range as shown. The condition range is set up in the asset's profile. Click here to learn how to create/modify an asset profile.
- Add comments or notes in the Details field.
- Click Save. Citywide will update projected condition information on the asset and add the assessment to the Condition Assessments grid.
Add a Condition Assessment using a Custom Formula
- Click Condition In the asset view.
- Click +New Assessment.
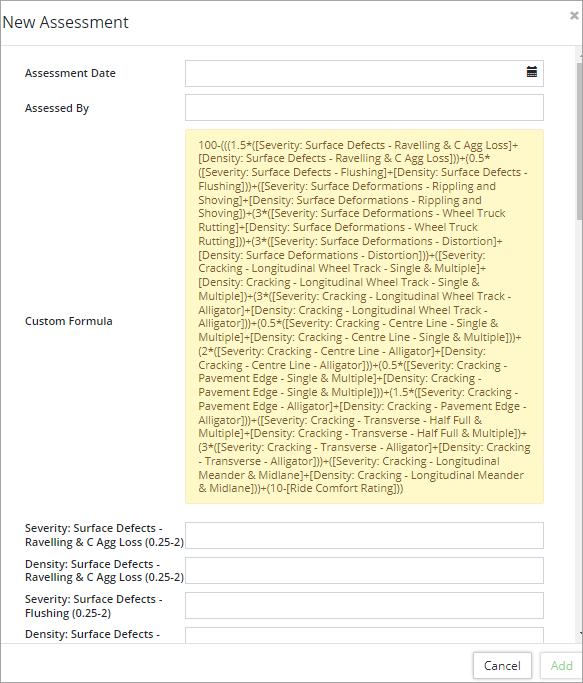
- Enter the Assessment Date (YYYY-MM-DD).
- Enter who completed the assessment in the Assessed By field.
- Review the formula and begin to enter information in the related Attributes.
- Citywide will calculate a Calculated Value and Condition Rating.
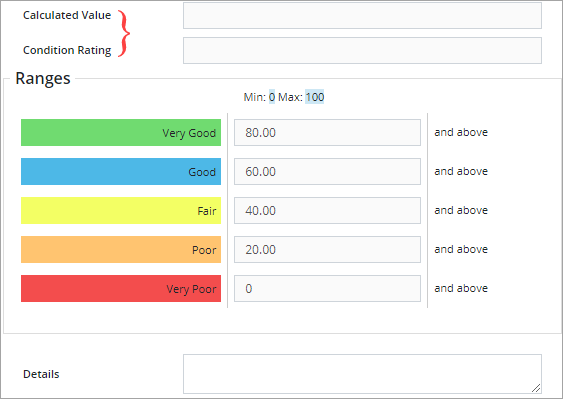
- Click Add.
Upload Multiple Condition Assessments
Bulk uploads can be completed in the Upload Center using the Asset Sync template. When uploading condition assessments only the standard method can be uploaded. If a condition assessment uses a custom condition formula than it must be entered manually at the asset level. To bulk upload condition assessments:
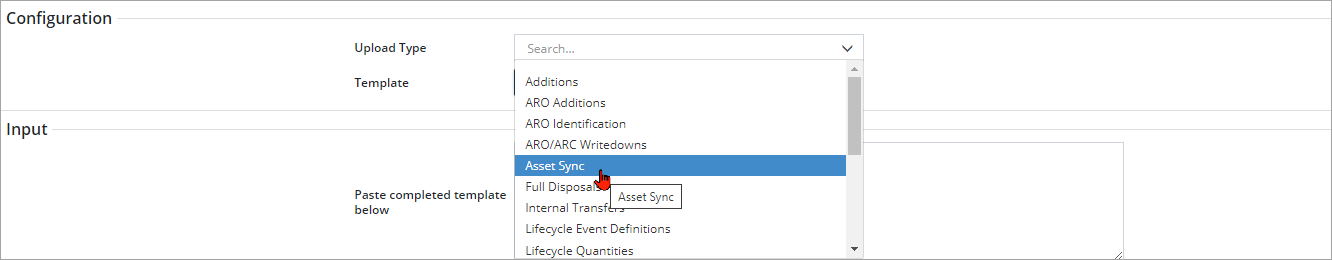
- Click Assets ð Upload Center.
- Click Upload Type and select Asset Sync.
- Select Click to Export.
- In the Customized Template window, Asset ID is a required fields and is set to Yes. Scroll down to Condition and select Assessed Condition, Assessment Date (YYYY-MM-DD), Assessed By, and Details.
- Once all fields are selected click Generate.
- Copy the string of text into a blank Excel worksheet. The string contains all the fields that will make up the template.
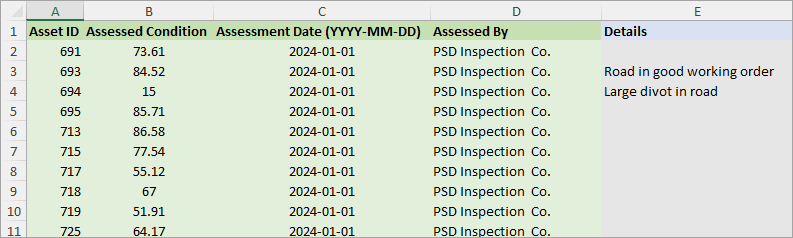
- In Excel enter in the details for each condition assessment (any condition assessments using a custom formula cannot be uploaded through this process). Asset ID, Assessed Condition, Assessment Date (YYYY-MM-DD), and Assessed By are mandatory fields and must contain a value. The Details field is optional.
The assessed condition must correspond with the condition range setup in the asset profile (i.e., if an asset's profile has a condition range of 0-5 then the assessed condition value for the asset must fall within that range.
- Once all condition assessments have been entered, copy all rows with data including the header row and paste it into the Upload Center, Input/Paste completed template below field.
- Review the data. Any errors will need to be corrected in the Excel spreadsheet. If a field in the header row is mapping incorrectly, click the lower field within the column and select the correct match.
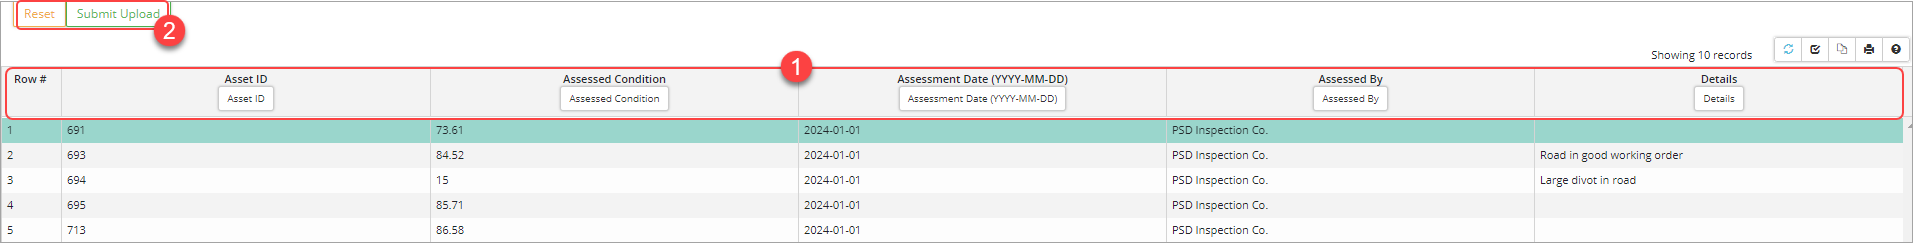
- Once reviewed click Submit Upload .
- If the upload is successful, Citywide writes the new information directly on the assets. There is no pending imports step when completing an asset sync upload.
Once condition assessments have been added, generate a Condition report to communicate and quantify the condition of your inventory. This report summarizes the projected condition. Citywide takes the most recent condition assessment and projects the assessed condition from the assessment date to the end of the reporting year. If a condition assessment does not exist on an asset, the report will use an age-based condition. When lifecycle events are included, the projected condition reflects condition assessment information and any lifecycle strategy activity that impacts the asset's condition for the reporting year (i.e., a road asset whose condition is improved after a resurfacing event).
- Click Assets ð Reports ð Levels of Service.
- Click Condition.
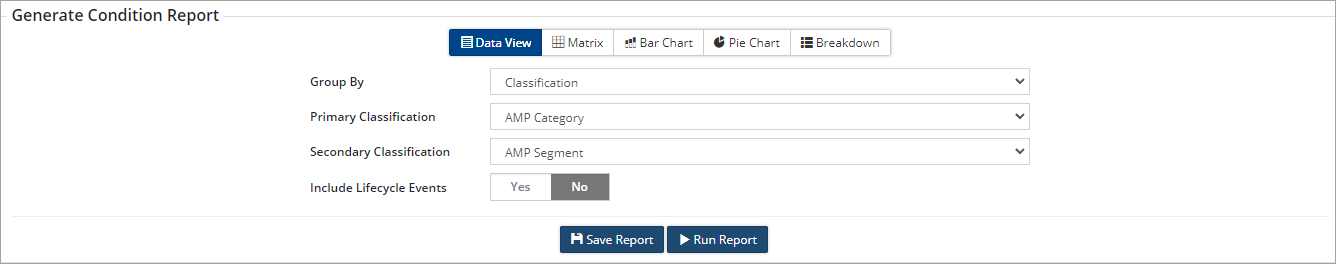
- Select a report type: Data View, Matrix, Bar Chart, Pie Chart, or Breakdown.
- Click Group By and select Classification or Profile.
- Select a Primary/Secondary Classification (i.e., AMP Category/AMP Segment) or a Profile (i.e., Roads). Use Ctrl + click to select multiple profiles.
- To report only on condition information without lifecycle activities set the Include Lifecycle Events flag to No.
- Click Run Report.
- Apply filters as needed. Options will depend on selections made in the previous screen
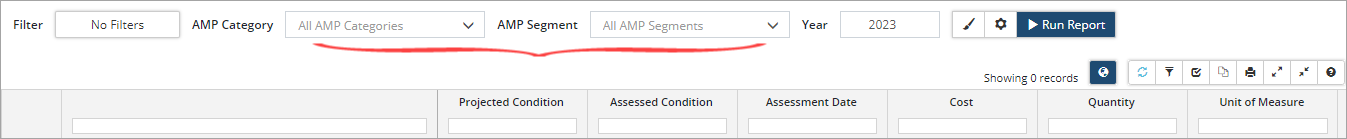
- Enter a reporting Year.
- Click Display Options to adjust # of Decimal Places within the report.
- Click Modify Report to change the Strategy Method or Costing.
- Click Run Report.
- Once generated the report can be exported to Excel
 or to PDF
  using the buttons on the toolbar.
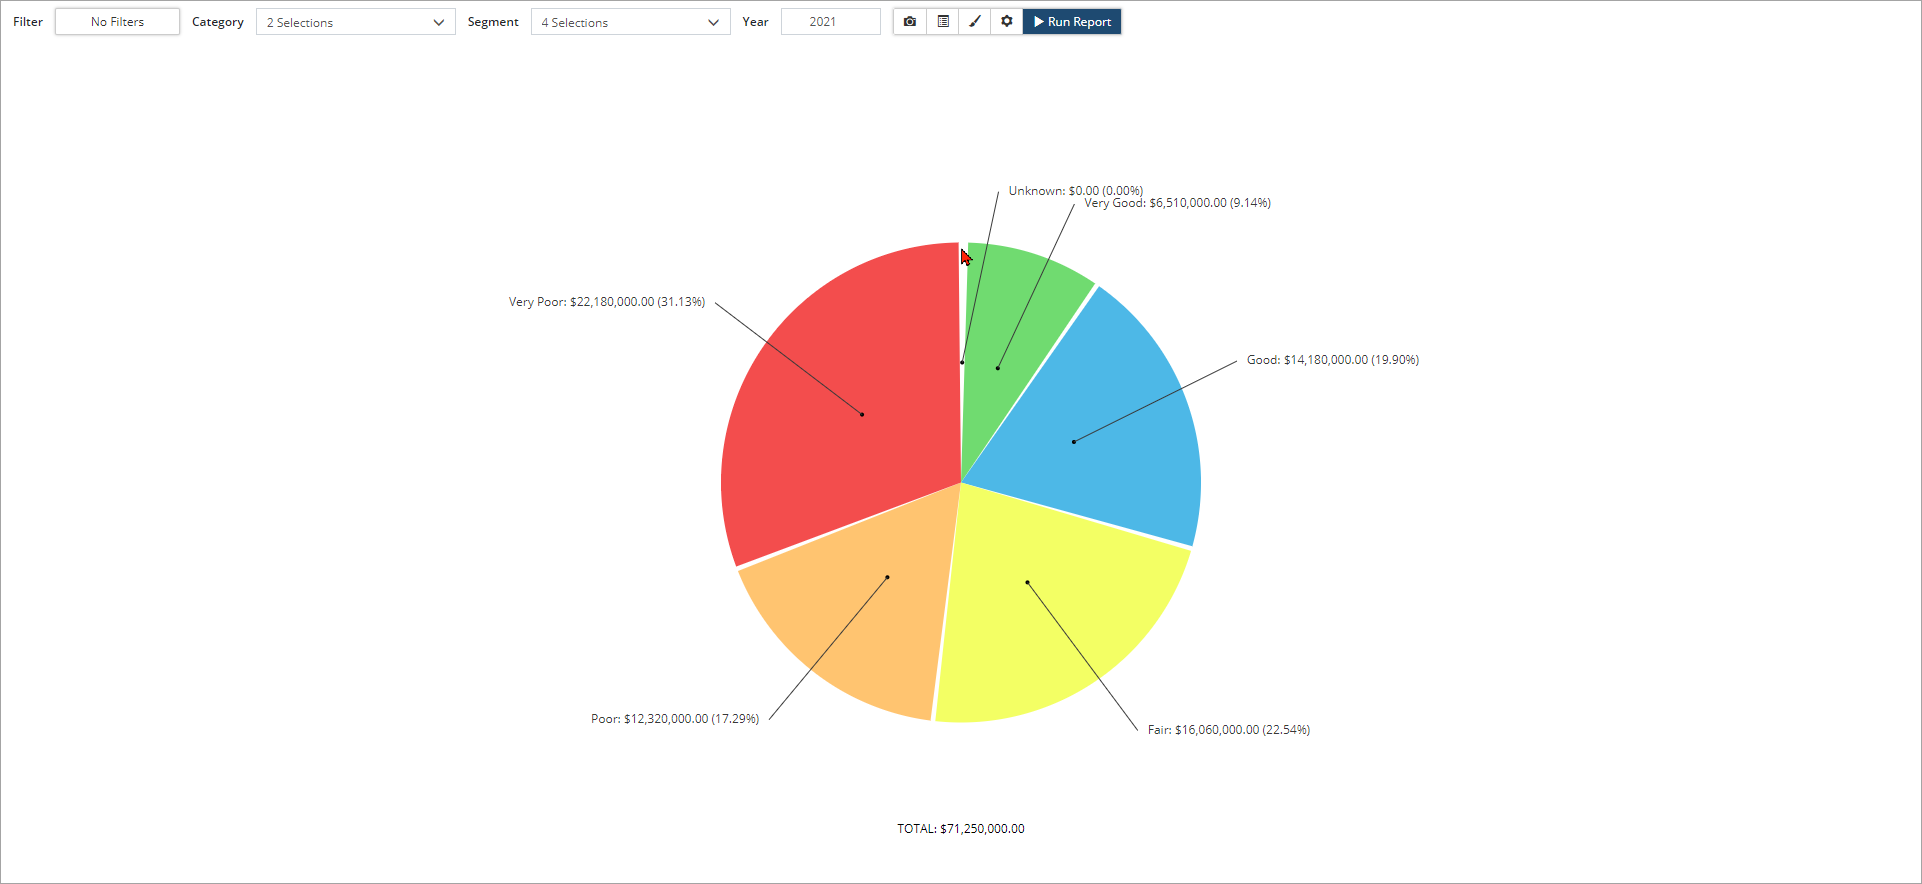
Condition Pie Chart Example
The Pie Chart below is reporting on the condition of assets based on condition assessments and does not include lifecycle events. A combined replacement cost, as well as, a percentage of the Total Replacement Cost for all assets being reported on is shown for each condition segment (Very Good to Very Poor).
Click ![]() to export the chart as a PNG or JPG file.
to export the chart as a PNG or JPG file.
Click ![]() to show the assets being reported on in the Inventory.
to show the assets being reported on in the Inventory.