GIS Viewer
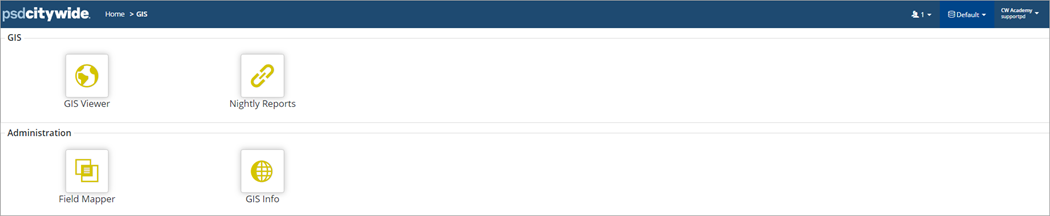
The GIS landing page consists of the GIS Viewer and the Linking Report, as well as Administration tools. To access Citywide GIS, navigate to Home 🢡 GIS.
|
Icon |
Description |
|
GIS Viewer |
Opens the GIS Map which consists of the open street map as the display background for feature layers in the Map Window, the GIS Toolbar and the Legend. |
|
Nightly Reports |
Details the results and statistics related to the most recent data linking operation and is often used to diagnose linking issues. |
|
Field Mapper |
An administration tool used to create new field mapping layers within GIS. The feature layers available for mapping are shown on this screen. |
|
GIS Info |
Provides basic configuration information about the GIS database like Geocoder Type, GIS License Type, and Geocoder Bounds. The screen also lists the Layers currently implemented for the database, as well as linking details, which allows for some basic troubleshooting information that can be used in the event a layer is not performing as intended. |
Map Window
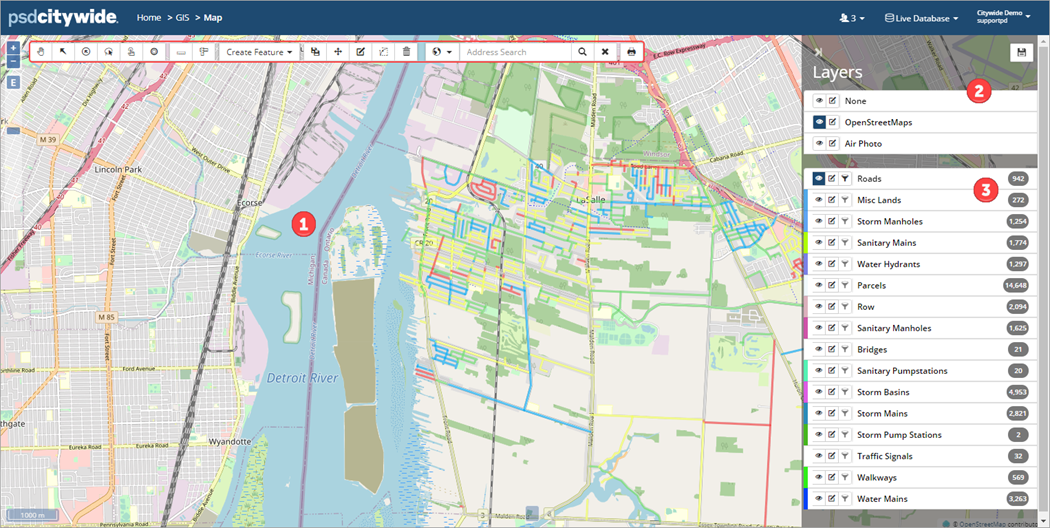
The Map Window ❶ displays asset feature layers on a base map, which provides a background for visualization. The Map window includes a Base Map ❷ and Feature Layers ❸.
Base Map
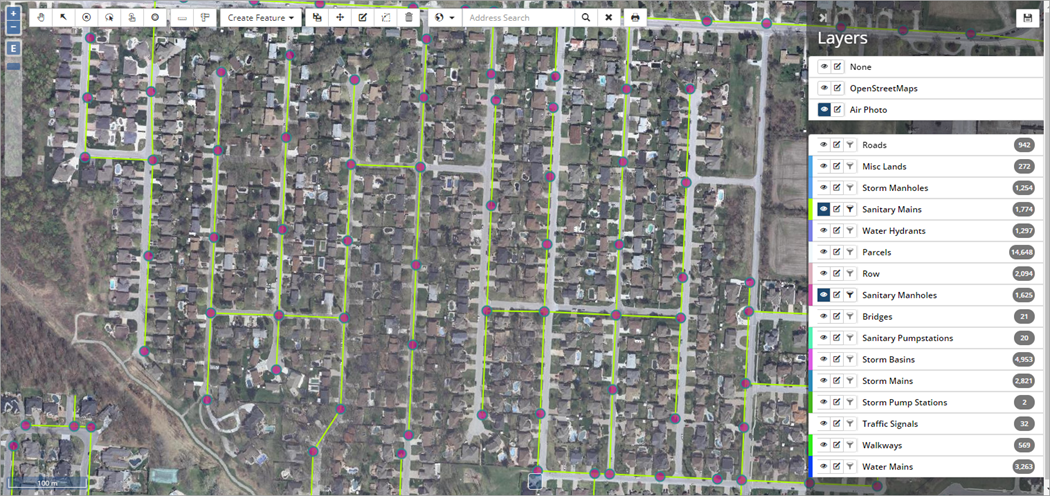
The base map layers are listed on the top section of the Legend. The standard base map in the Citywide GIS Viewer is based on open-source data from OpenStreetMaps (OSM). An image of the GIS Viewer with Sanitary Mains and Manhole features displayed on the default OSM base map is shown below. The set of tiles that make up the base map are periodically refreshed.
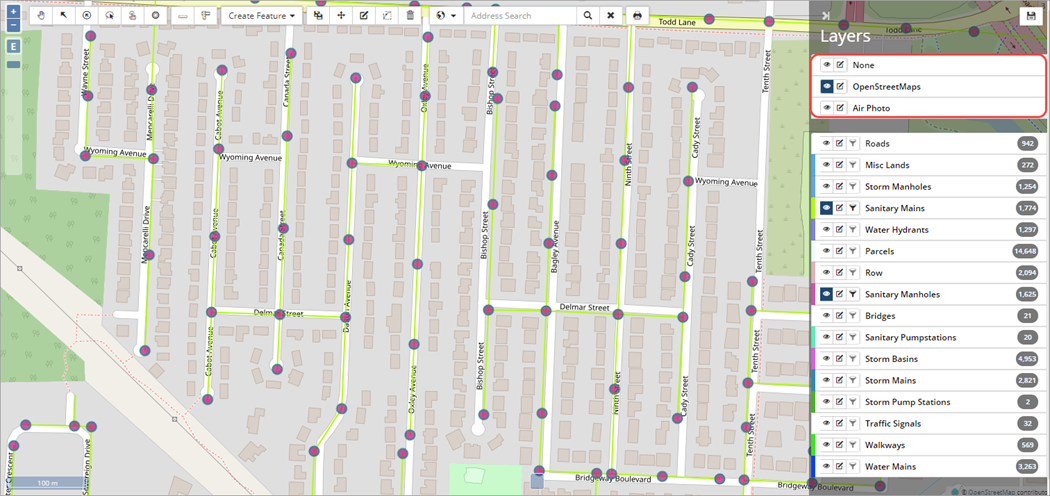
The system allows for a single base layer to be displayed as the background. Click ![]() (Toggle Layer Visibility) to switch between base layers. Selecting None turns off the base map and the feature layers display on a white background.
(Toggle Layer Visibility) to switch between base layers. Selecting None turns off the base map and the feature layers display on a white background.
Aerial photographs can also be loaded as a base layer in the map window, to allow relating the location of assets to the urban form and topography. The same asset layers are shown in the image below with the Air Photo as a base map.
Aerial imagery may need processing (depending on the file format) before being uploaded in the GIS Viewer and hence, are handled on a case-by-case basis in consultation with the Citywide technical team.
Custom base maps can be loaded into Citywide GIS through an import of a shapefile or integrated directly from a REST service provided by the client, typically via published web map services. The styling, labeling, and colour scheme can be customized by the client.
Feature Layers
The GIS Map can display infrastructure asset layers and municipal contextual layers such as administrative/planning boundaries and aerial photographs. It offers the ability to view/interact with features, and link features on the map to Citywide Assets, Maintenance, or Permitting. Data provided via a shape file or a web map service appears as one or more layers in the GIS Viewer, that can be toggled on/off, as well as searched and filtered.
There are two methods for uploading and maintaining GIS data in Citywide GIS:
|
Method |
Description |
|
Shapefiles and Imagery |
Asset data is provided via shapefiles and areal imagery is accepted in industry standard image file formats. One set of shapefiles represents a single asset category such as Roads, Watermains, Culverts etc. These shapefiles are processed and linked to asset IDs (where available) in the Assets module. |
|
Web Map Services |
Alternatively, a client can provide GIS feature data in the form of a web map service via an Endpoint URL. In this case, there are no additional maintenance requirements to refresh or update the dataset. The system pulls the latest data from the REST service each night and stores it in the Citywide database. |
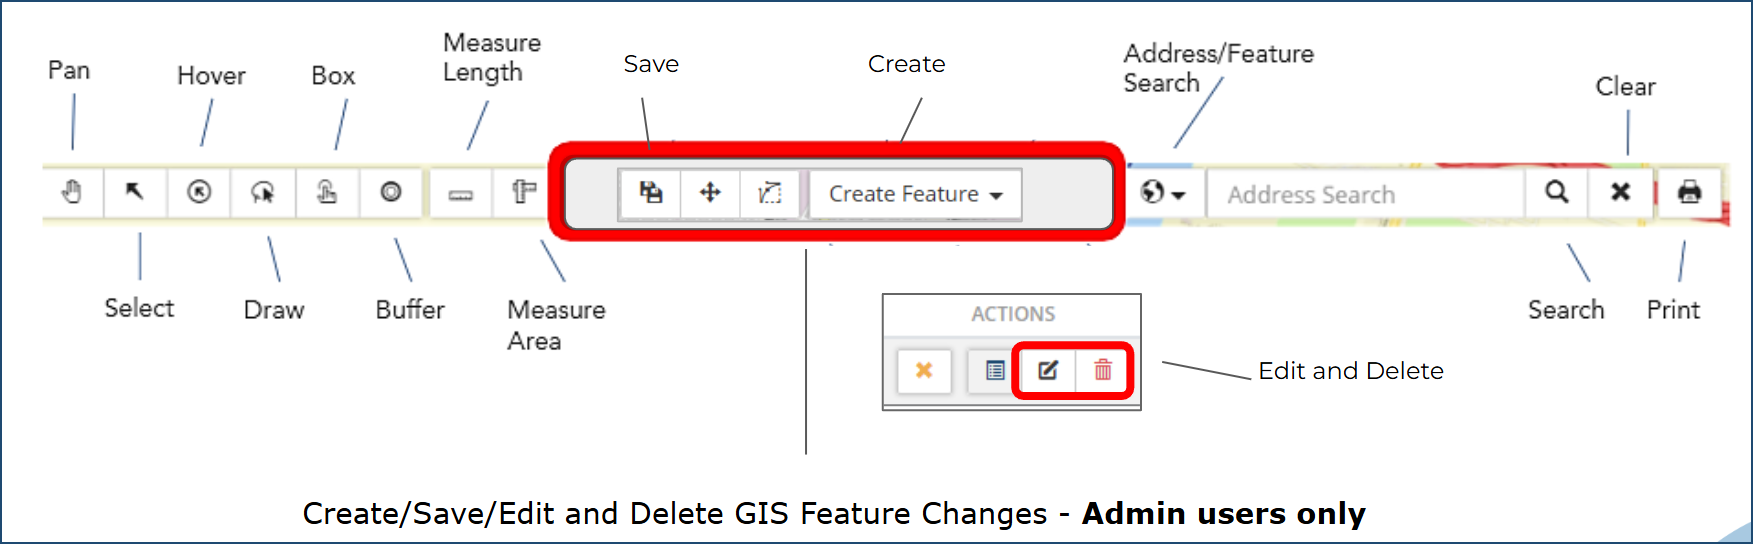
The toolbar at the top of the Map window includes navigation and selection tools as well as edit and search functions available in Citywide GIS. (Note: 'Create, Save, Edit and Delete' feature capabilities in Citywide GIS along with the 'Actions' icons in the attribute table can only be used by admins on the Full and Enterprise GIS licence type. Please refer to the GIS Overview and Licencing article for further info.)
Zoom and Pan Tools
Zoom and pan tools are used to adjust the map to the desired view and scale.
|
Tool |
Description |
|
|
Click Zoom in/Zoom out on the top left corner of the Map window to zoom in and out of the map at fixed zooming levels. |
|
Click Fit to extent to zoom the screen out to the map’s maximum extent. |
|
|
Click and drag the slider up or down to control the zoom level. The mouse scroll wheel is a convenient and quick zooming tool as well. |
|
|
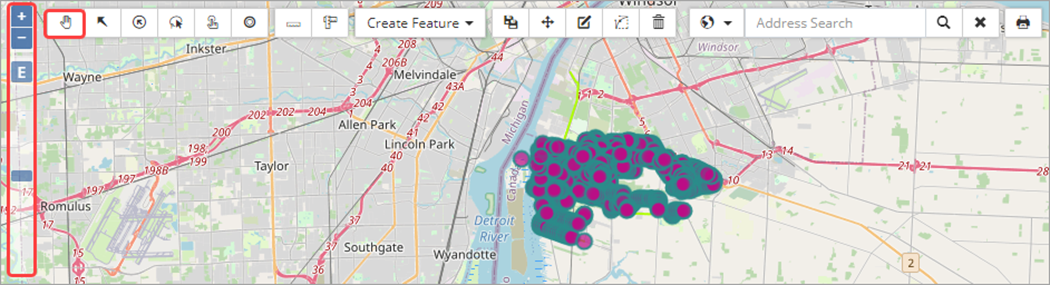
Pan/Drag map is used to drag the map screen using the mouse. Click to select the tool (a blue background indicates the tool is active). Click and drag the map to the desired location. Zoom as needed. |
Use Shift+click and drag to quickly zoom into an area. For example, to zoom into an area of the map, position the mouse in that area, hold the Shift key then click and drag the mouse until a blue box surrounds the area that you would like to zoom into.
Selection Tools
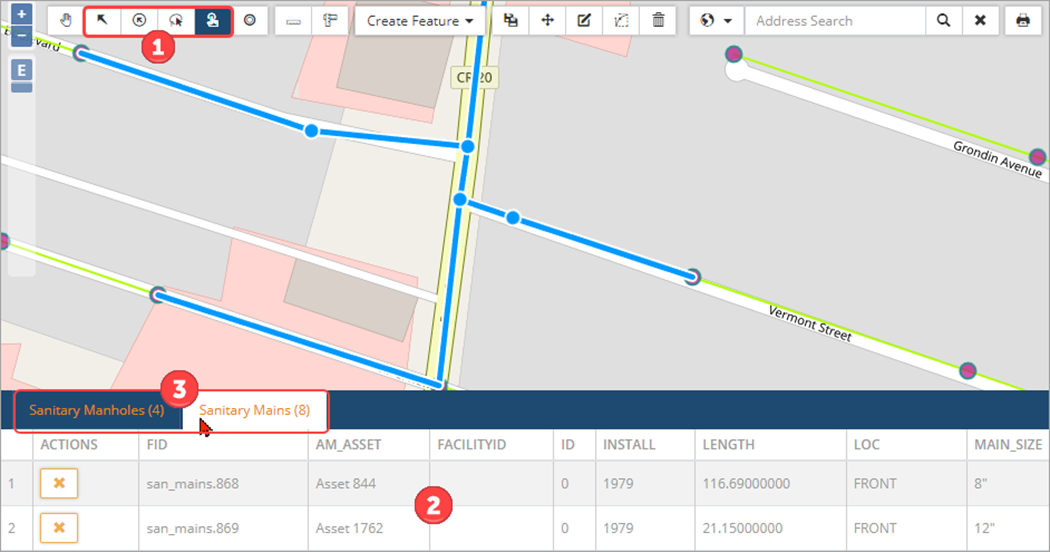
Selection tools ❶ provide several ways to select a single feature or multiple features on the map and display corresponding details in the Attribute table ❷.
|
Tool |
Description |
| The Select tool selects one feature at a time and once selected, the layer’s name and the feature’s details display in the attribute table (values pulled from the layer’s attribute table). Hold Shift to select multiple features with this tool. | |
| The Hover to select tool allows the user to view the features’ layer and attributes as the mouse hovers over each feature without selecting the feature first. It is a quick way to assess what assets are displayed. | |
Draw to select is used to select multiple features. Two methods can be used:
|
|
| Box select is the quickest way to select multiple features in multiple layers. Hold Ctrl and drag to draw a rectangular box on the map to select all features that fall within or intersect with the selection box. The layer tabs ❸ in the Attributes table can be switched to view asset details of different layers. |
De-select features by clicking X under Actions in the attribute table. Closing the attribute table or selecting another tool will also de-select the current selection.
Analytical Tools
| Tool |
Description |
The Buffer tool is used to create a buffer and select features within the specified buffer radius of a point on the map (e.g. an intersection) or a point feature (e.g. a manhole). To set a buffer:
|
|
|
The Distance tool calculates the straight-line distance between any two coordinate points selected by the user on the map. The unit of measurement is metres or kilometres. |
|
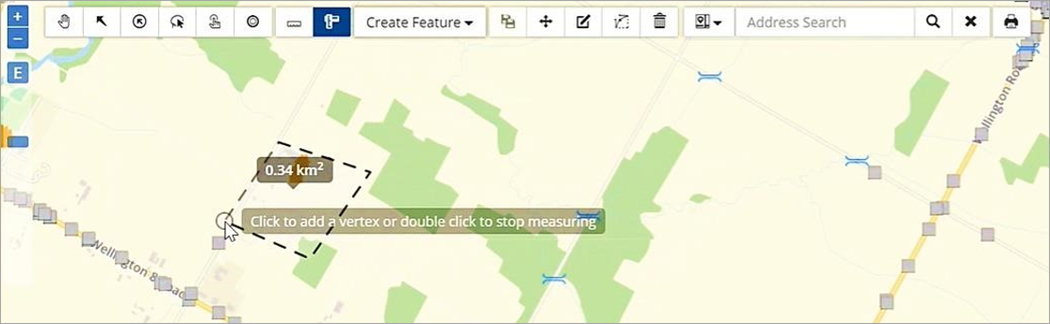
| The Area tool calculates the area of a polygon as defined by the user by selection of points on the map. The unit of measurement is square metres or square kilometres. |
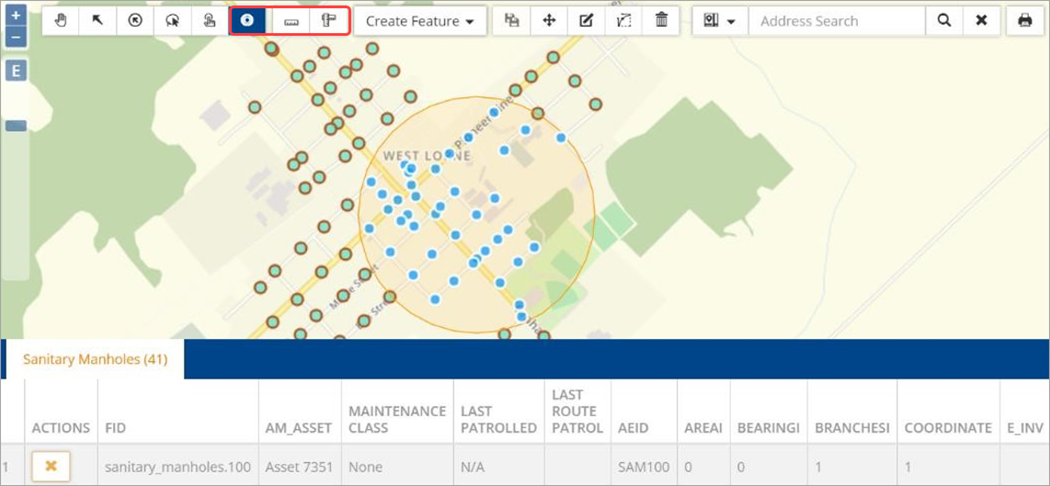
The following image shows the buffer radius set to 500m.
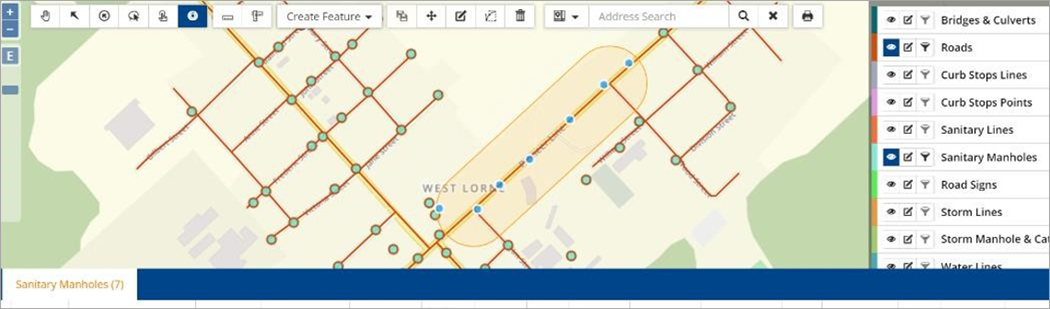
The following image shows the buffer radius set to 200m.
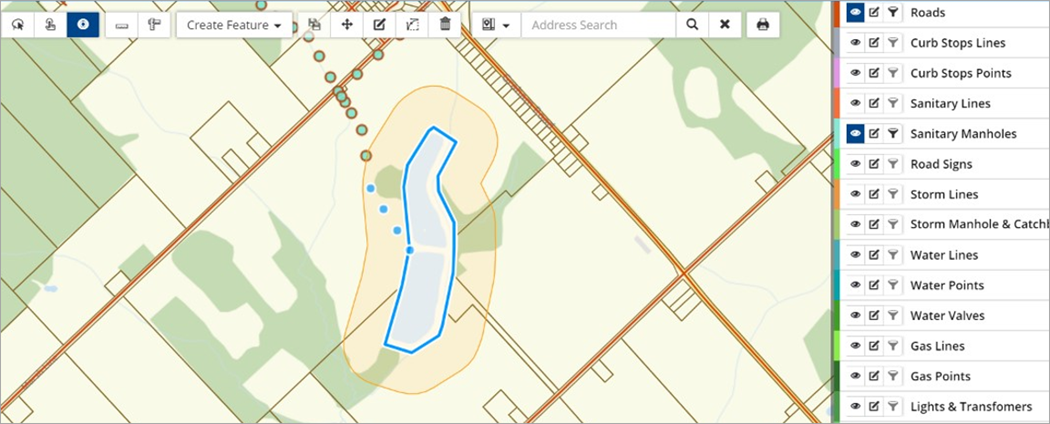
The following image shows manholes within a 200m buffer of the wastewater treatment plant.
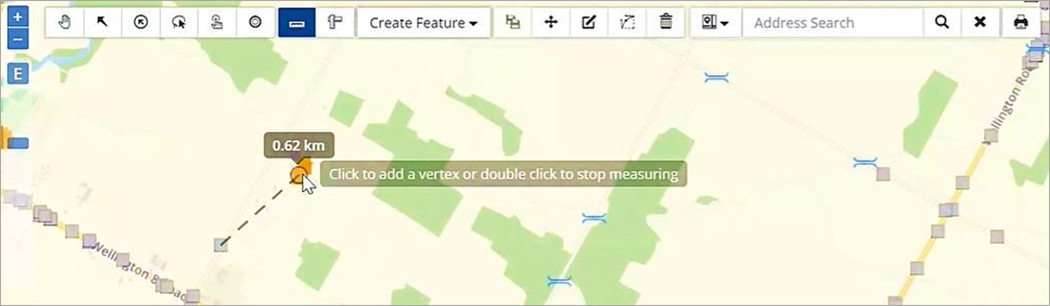
The following image shows the distance between two coordinates as .62 km.
The following image shows the area measured as .34km2.
Address or Feature Search
The Address Search field is used to locate a property address, street or landmark like a school or park name. The Geocoder searches an address within the township using open-source data by default. Custom searching options are available for more accurate results like configuring the Geocoder with client’s address source data via shapefile/map service or a custom geocoding service provided by the client. These options are described in more detail in the section on Geocoder.
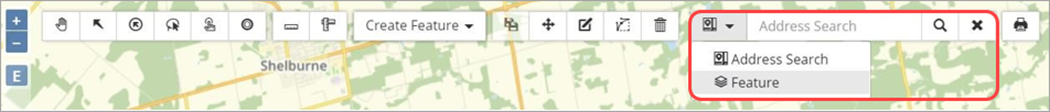
A Feature search is also available to allow for keyword/number searching.
Address Search
A street name, or a landmark (i.e., a building or park name) can be searched on the default geocoder in addition to property addresses.
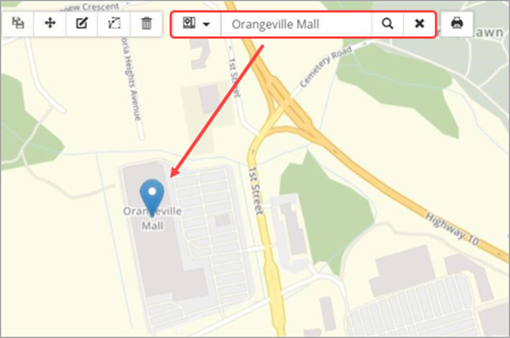
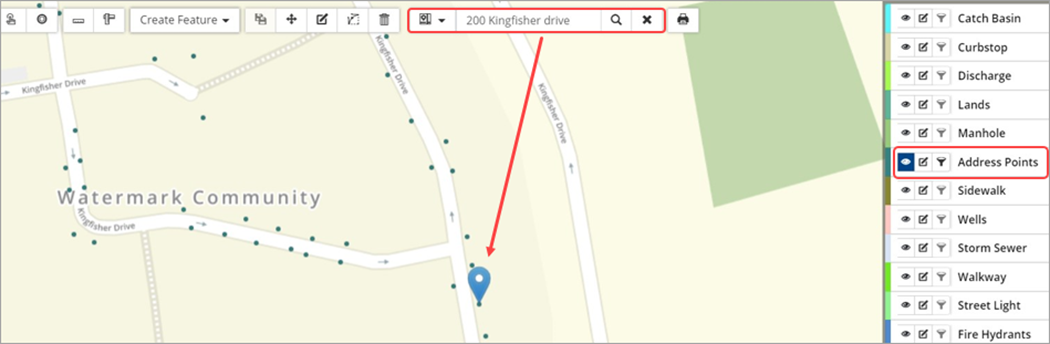
The example below has the address point layer set up as a custom address search source. The address in the search bar is accurately located by the geocoder as the location marker is shown on the address point.
Feature Search
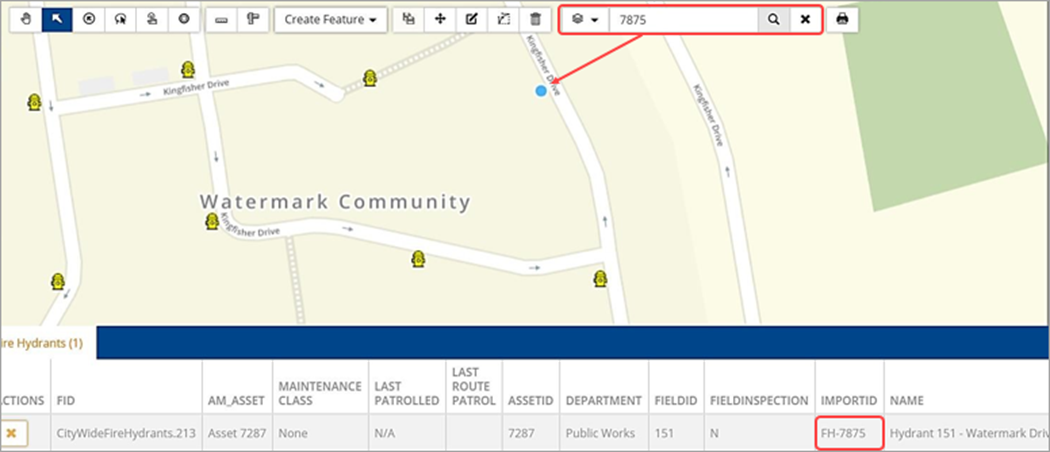
The Search option can be switched to Feature from the drop-down menu allowing users to search for any information in the attribute tables of the GIS layers. The following example shows a feature search by Hydrant ID.
Printing
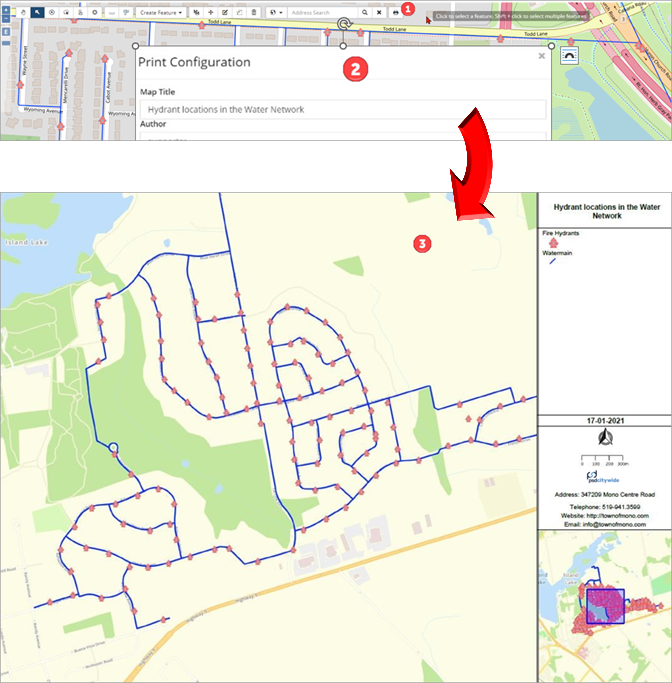
Click Print Map ❶ to print the features as seen on the map window to PDF. A sample printed map can be seen below with the title ❷, legend, North and other map elements ❸.
Legend
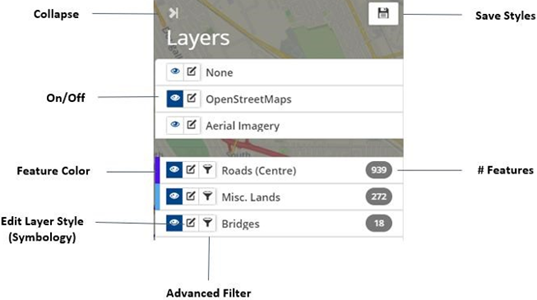
The legend displays the list of feature layers loaded in the GIS database. The top section of the legend displays the Base Map layers which can individually be toggled on/off by clicking the corresponding layer visibility button . Asset layers are listed underneath, with the layer color shown on the left feature colour strip. Multiple layers can be turned on at the same time.
Users can customize the layer symbology and filter features based on layer attributes as well as reorder and rename layers listed. All changes made to the layer styles or order can be saved for all users by clicking Save at the top of the legend.
|
Option |
Description |
|
Collapse (>|) |
Minimize/maximize the Legend. |
| Globally saves changes made within the Legend (i.e., Layer name, order, symbology, etc.). | |
| Toggles layer visibility on/off (when on the button is blue). | |
| Edit layer style includes options to modify the Layer and Text style, as well as, add symbols or cluster point features in close proximity. When GIS data is linked to Assets data, additional styling is available to help visualize the status of the visible features/assets. Note: (if required) To access this functionality, click 'pan and drag' |
|
| The Advanced Filter provides users with the ability to query a layer’s data based on AM attributes or Feature attributes. | |
| Feature Colour | The feature colour handle is used to reorder the layers on the Legend as well as identify the feature by colour in the map window. Click and drag the feature colour handle to reorder the layer (the mouse pointer changes shape ). |
| #Features | The total number of features contained within the layer. |
The various layer style and filter tools available within Citywide GIS provide users with the ability to produce maps for the purpose of planning capital work. Users can visualize asset attributes such as the condition of bridges, or identify the location of assets such as where a majority of streetlights are located through clustering, or query asset data to determine network pipes of the same material. The following pages describe the tools available in Citywide GIS.
Edit Layer Style
Editing options ![]() will depend on the layer type (base map or feature) and the feature class.
will depend on the layer type (base map or feature) and the feature class.
- Base map layers: The only option available is to modify the Opacity of the layer.
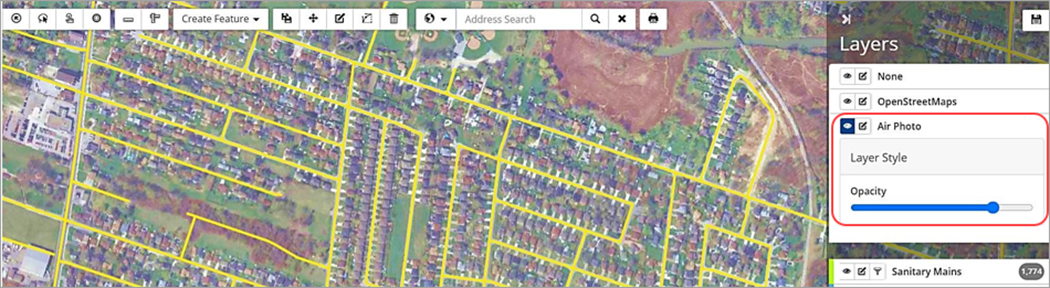
- Feature layers: (if required) To access this functionality, click 'pan and drag'
 icon on the map.
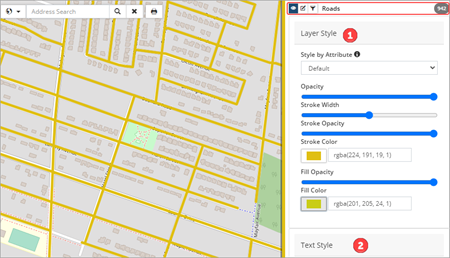
Line, polygon, and point feature layers have options for editing the layer style ❶ and text style ❷. Layer style options include stroke colour and width whereas text style options are used to add text labels to the assets visualized on the map.
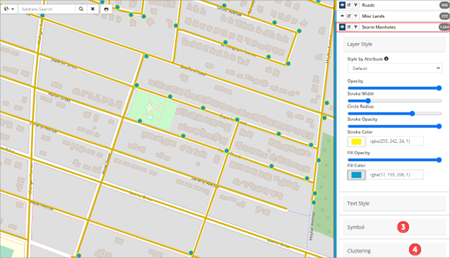
Point feature layers (i.e., water hydrants, storm basins, etc.) will also have symbol ❸ and cluster ❹ editing options.
| Image 1: Line feature layer (Roads) | Image 2: Point feature layer (Storm Manholes) | |
 |
 |
Layer Style – Users can modify colour and width to further enhance the visualization of the asset layer within the map viewer. Options include:
- Style by Attribute: When GIS data is linked to Assets data, additional styling is available to help visualize the status of the visible features/assets.
- Opacity: Click and drag to adjust the opaqueness of the layer colour.
- Circle Radius (Point feature layers): Click and drag to adjust size.
- Stroke Width/Opacity/Color: Click and drag to adjust the width/opaqueness of the assets or click the color icon to change colors. Once a new color is selected click the color icon again.
- Fill Opacity/Color (Point Feature Layers): Click and drag to adjust the fill opaqueness or click the color icon to change colors. Once a new color is selected click the color icon again.
Style by Attribute
Style by attribute is used to visualize asset attributes such as condition, risk, amortization, and MMS Compliance (For Patrols).
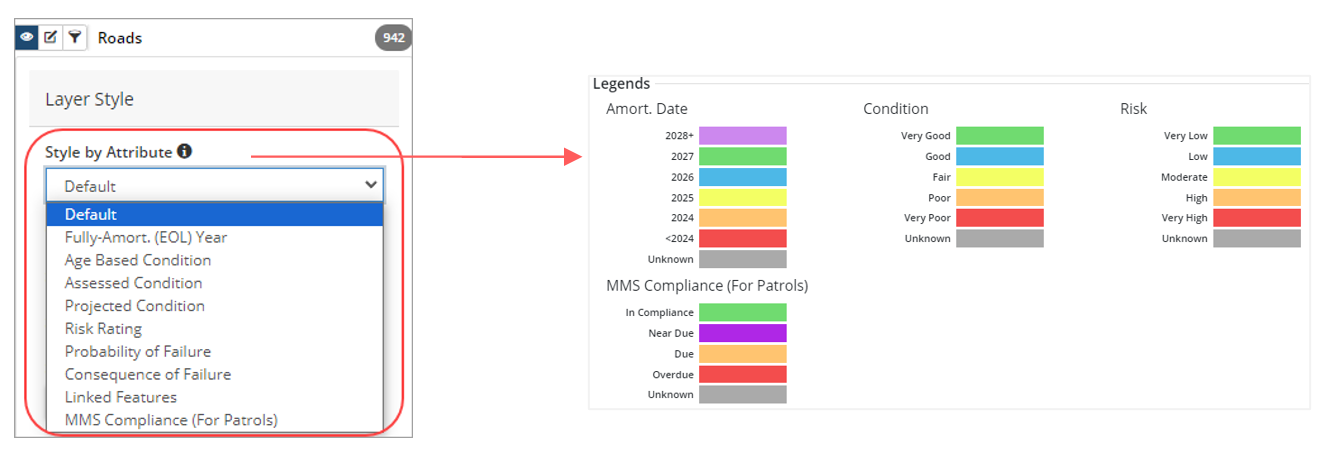
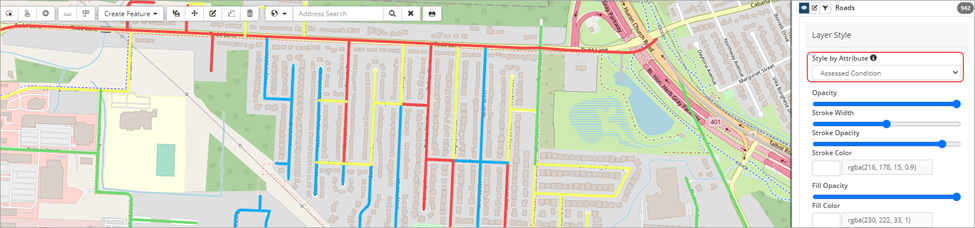
For example, to view condition information of the asset layer (as shown in the screenshot below) click Style by Attribute and select either Age Based Condition, Assessed Condition or Projected Condition. Click the information icon ![]() to view legend information.
to view legend information.
To view linked information on the asset layer, select Linked Features. Linked assets will display in green, and unlinked features in red.
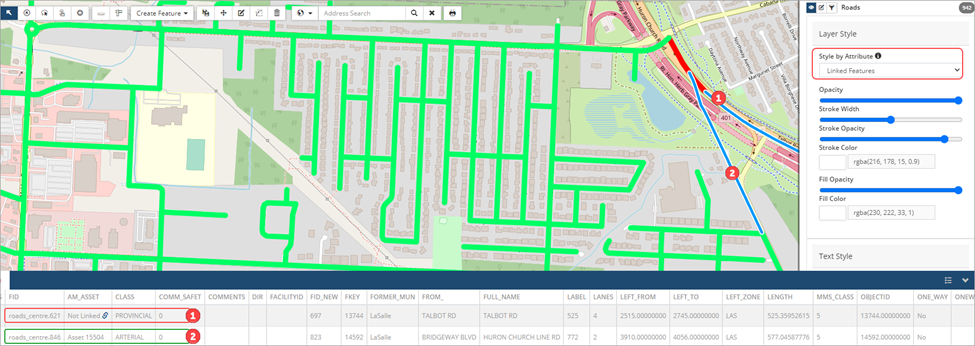
When a feature layer is styled by an attribute, the stroke/fill colour options are not available since the styling options are pre-set. Click ![]() to view the legend.
to view the legend.
Text Style – Users can add text labels to a feature layer displayed on the map. Click the Text Field dropdown to view which feature attribute can be added for the layer.
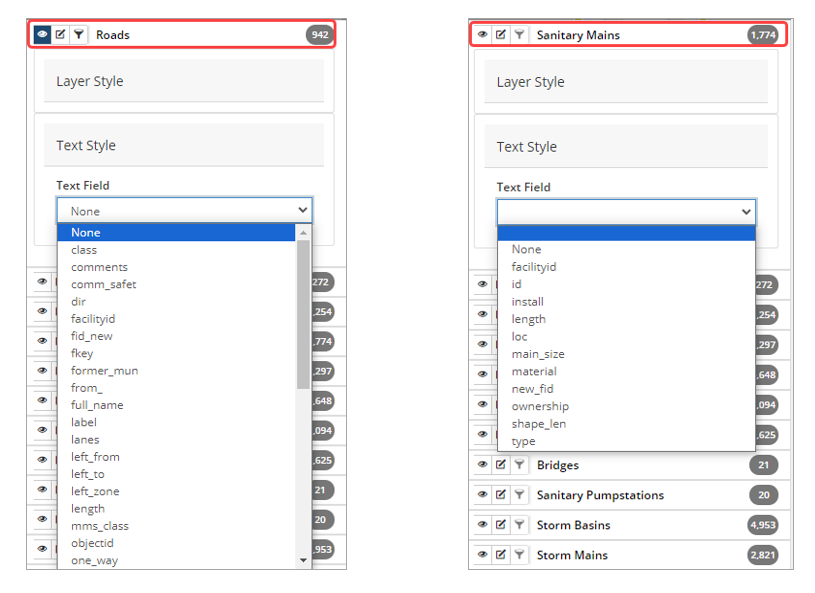
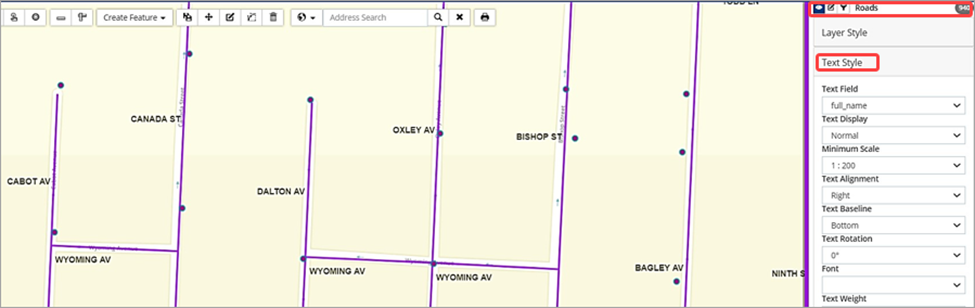
Once a feature attribute is added, the displayed text can be formatted for scale, alignment, offset, font, size and color. The image below shows Road assets with a full name label.
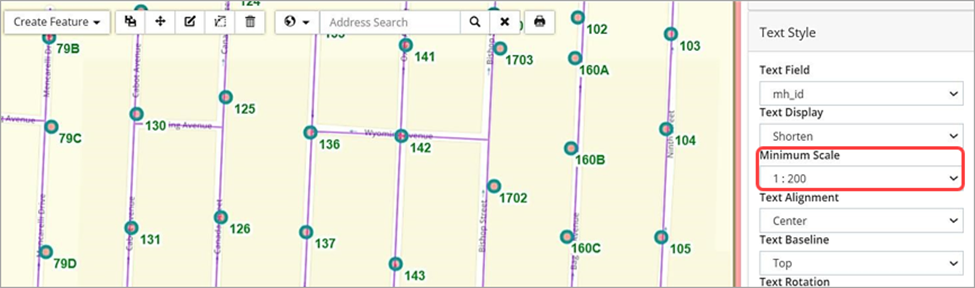
The image below is an example of Text Style editing for a point feature layer. The scale at which the text labels become visible on the GIS map is set in the Minimum Scale field. This helps to prevent crowding on the screen and is useful for printing maps at different scales.
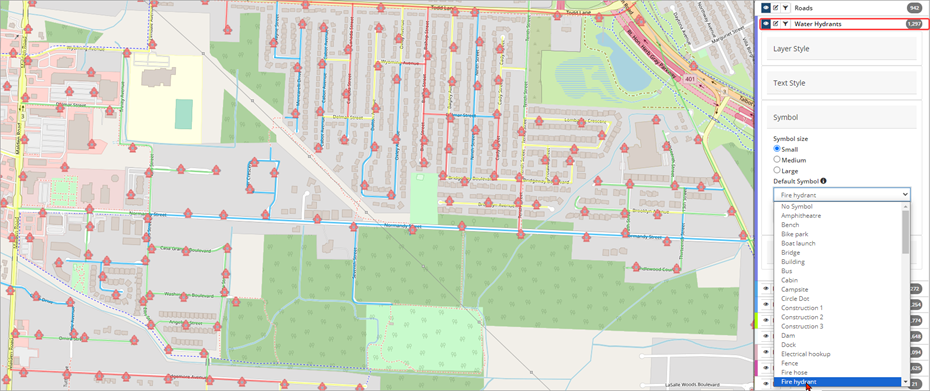
Symbol (point feature layers) - Special symbols can be selected for a feature layer to differentiate it from other assets. Users can set the symbol size and select from a list of pre-defined symbols.
Clustering (point feature layers) – Clustering is used to improve display efficiency of point geometries. Clustering a layer combines points of close proximity into clusters and simplifies the display of point features on the map. The number on a cluster indicates how many point geometries it contains. Clustering is only available in pan mode. To cluster a layer, set the Cluster Layer flag to yes and enter a minimum distance.
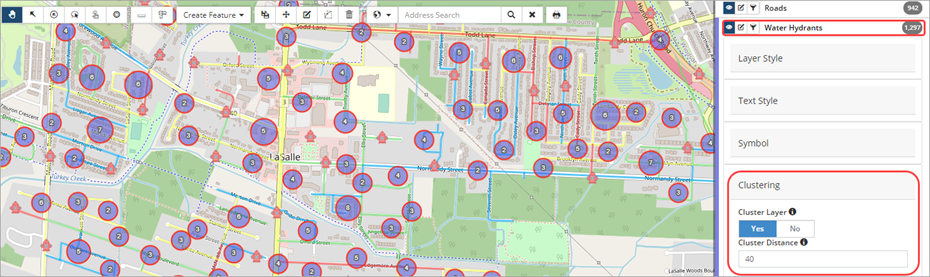
Clustering is a dynamic display option. The size of the cluster will update according to the zoom level of the screen.
External Layer Styles
Note: The ability to set External Style to Yes/No is only available in Pan mode.
When the layers in Citywide GIS are remotely integrated with the client’s web map services using REST endpoints, the layer settings are imported as well and display as configured in the client’s GIS. Clients with this setup will see a Use External Style flag when the Edit Layer Style button ![]() is selected. The flag is set to Yes by default.
is selected. The flag is set to Yes by default.
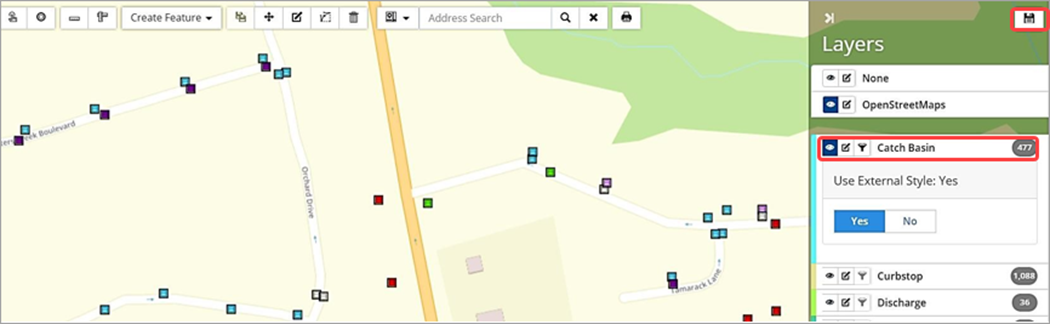
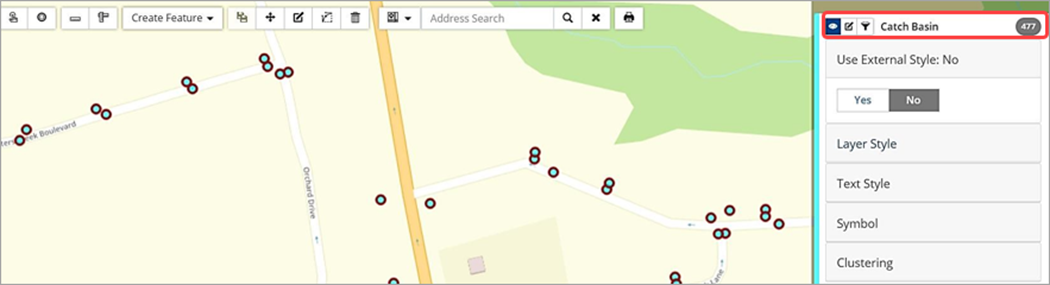
Toggle Use External Style to No to enable local editing options for layer, text, symbol and clustering (as applicable). Click Save in the top right above the legend once changes are made.
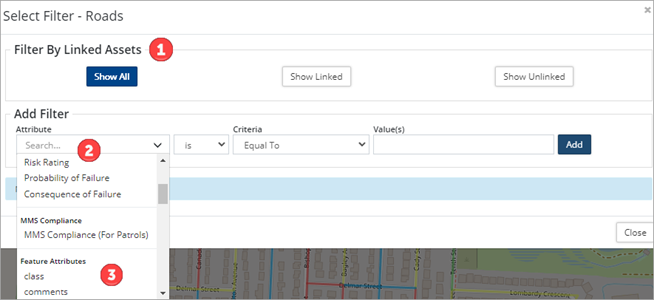
The Filter button ![]() provides users with the ability to query the GIS data of a layer based on AM attributes or Feature attributes. Filter options include:
provides users with the ability to query the GIS data of a layer based on AM attributes or Feature attributes. Filter options include:
- Filter by linked/unlinked assets ❶.
- Filter by asset attributes ❷ such as condition, risk, amortization, and MMS compliance.
- Filter by GIS feature attributes ❸.
To filter a layer, toggle the layer visibility on and then click the layer’s filter button. The filter button only activates once the layer is displayed in the map viewer.
Filter by Linked Assets
When a feature layer is linked to Asset data, users can filter the layer to show linked or unlinked assets in the map viewer. For example, to show unlinked assets for the bridge layer:
- Click the Bridge layer’s filter button
 .
.
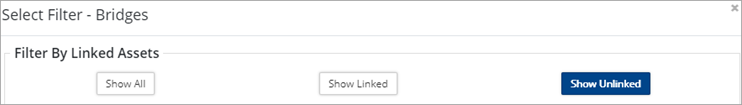
- Select Show Unlinked in the Select Filter – Bridges
- Click Close. It may be necessary to hide other layers and remove any active filters to clearly see the layer in question.
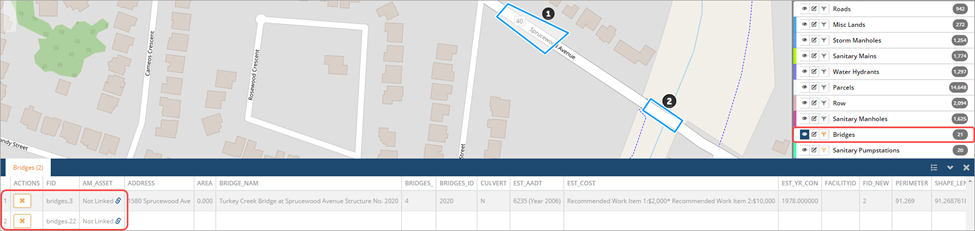
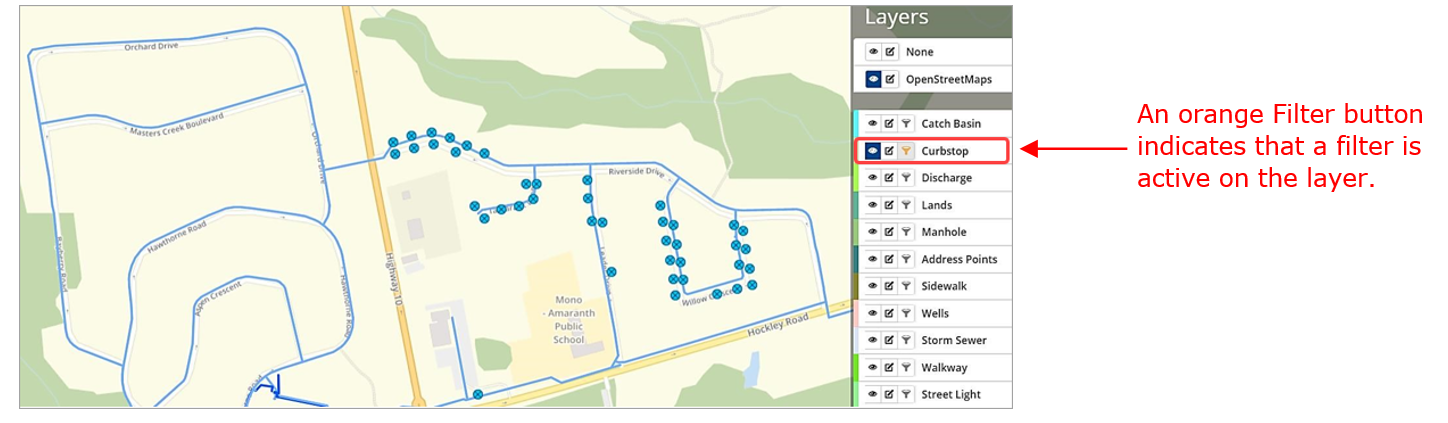
- The Filter button is now orange
 indicating that a filter is active on the specific layer.
 - To remove the filter, click the filter Select Show All in the Select Filter – Bridges window and click Close.
Filter by Asset Attributes
When GIS data is linked to Assets, users can filter feature layers by asset attributes such as condition, risk, etc. To filter a layer by asset attribute:
- Click the layer’s filter button.
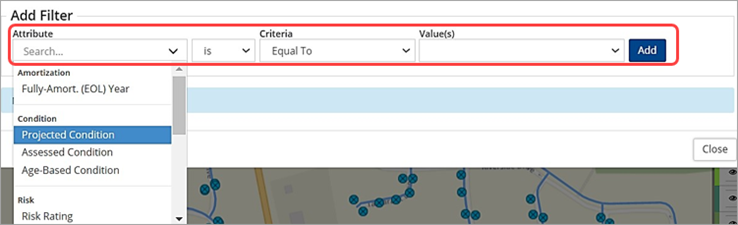
- Select an attribute (i.e., condition).
- Select is or is not.
- Set a Criteria and Value. When the attribute is set to a condition, risk, or MMS Compliance (For Patrols) option, the Value field will list the corresponding values used in Assets or Maintenance. For example, if the attribute selected is Projected Condition, then the values listed are Very Good, Good, Fair, Poor, and Very Poor.
- Click Add. The query is added as a lined item that can be edited or deleted, and the filter is applied to the layer data. Multiple filters can be added by repeating steps 2-5.
- Click
 to edit a query. Once changes have been made click the save button
  to update the query and reapply it to the layer.
 - Click
 to delete the query and return the layer visibility to show all.
Example: Condition filter applied to a Curbstop layer
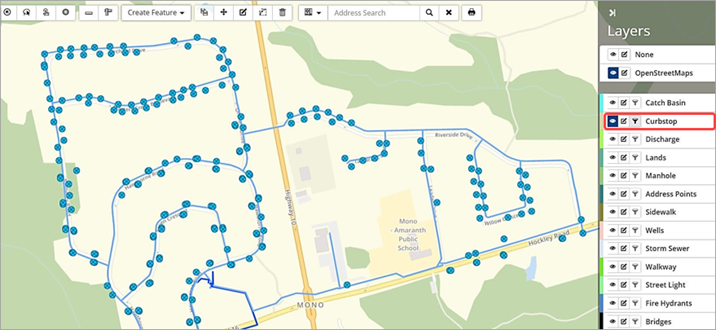
The screenshot below shows the feature points displayed for all curbstop assets.
To filter the layer to show curbstop features with an age-based condition equal to good:
- Click the layer’s filter button.
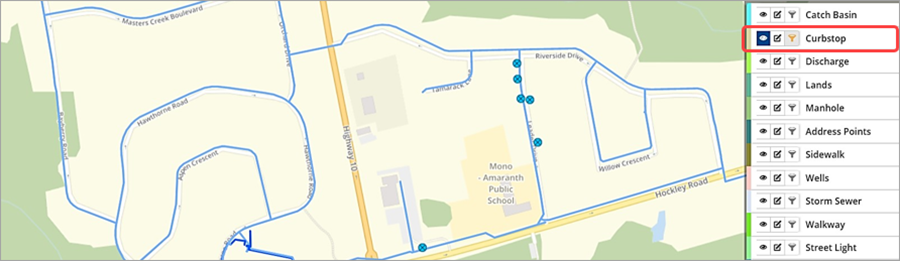
- Create a query that filters for: Age-Based Condition is Equal To Good ❶.
- Click Add to apply the query.

- Click Close to view the filtered results.
- To compare results, a second query is created for Projected Condition = Good.
Filter by GIS Feature Data
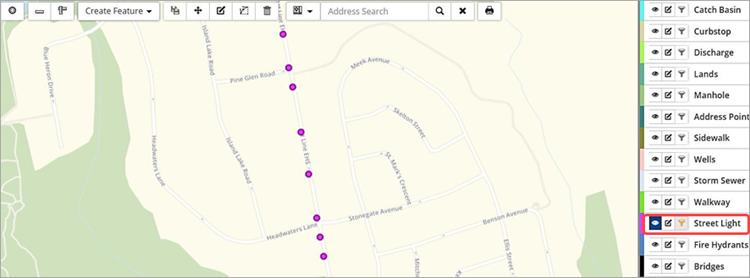
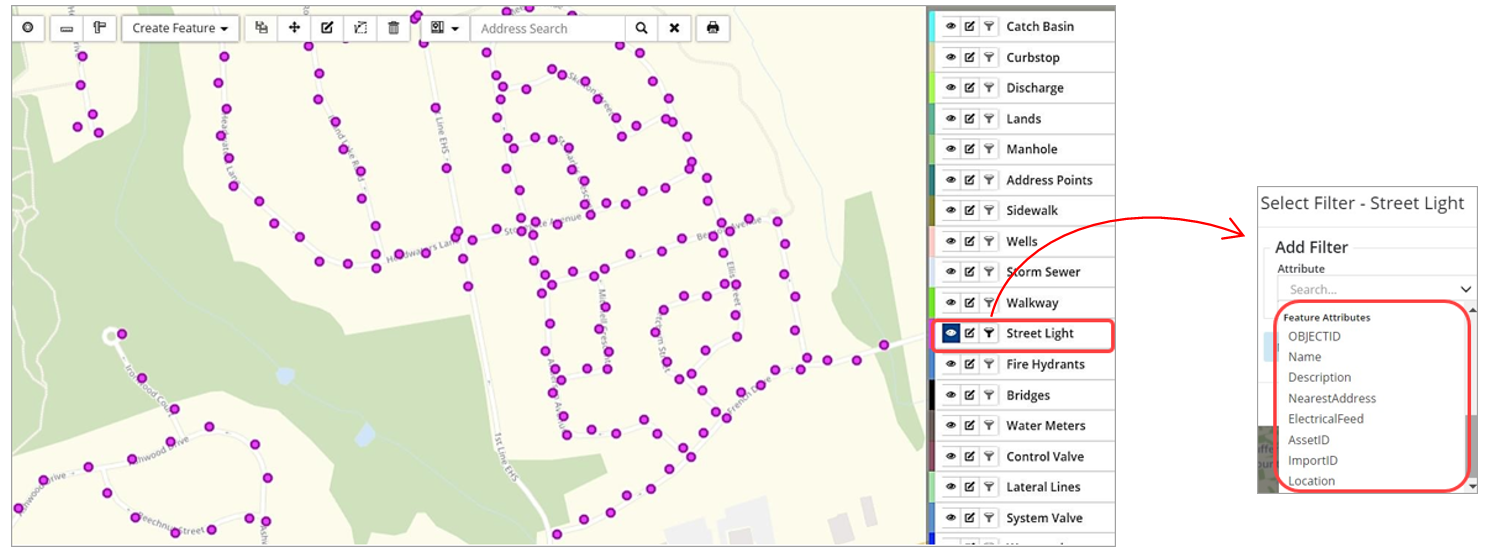
In addition to AM attributes like Amortization, Condition, Risk and MMS Compliance (for road patrols), the layer’s GIS feature attributes can also be queried. The feature attributes available for filtering will relate to the selected feature layer. The screenshot below examines the feature attributes that can be queried for a Street Light layer.
To filter the layer to show streetlights with above ground electrical feed:
- Click the layer’s filter button.
- Create a query that filters for: Electrical Feed is Equal To Above Ground ❶.
- Click Add to apply the query.
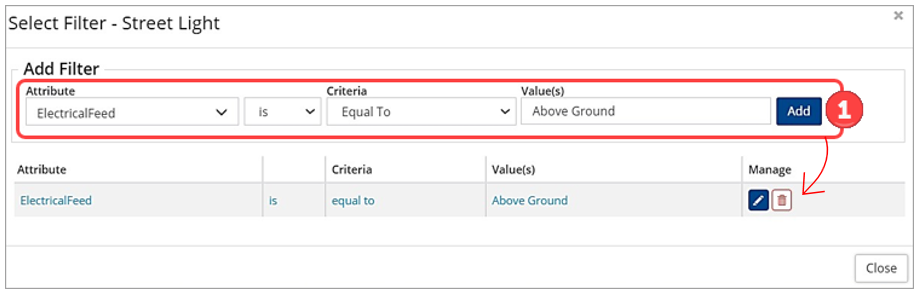
- Click Close to view the filtered results.