Scenarios inform discussions on how to best use funding $$ to maximize performance of a group of assets while minimizing risk to the organization. Multiple scenarios with different funding amounts can be created. Scenarios are based on specific levels of funding and provide the:
- Ability to determine levels of service
- Average asset performance/condition
- Average asset risk
Create a scenario
- Navigate to Decision Support 🢡 Scenario.
- Click +New in the top right corner.
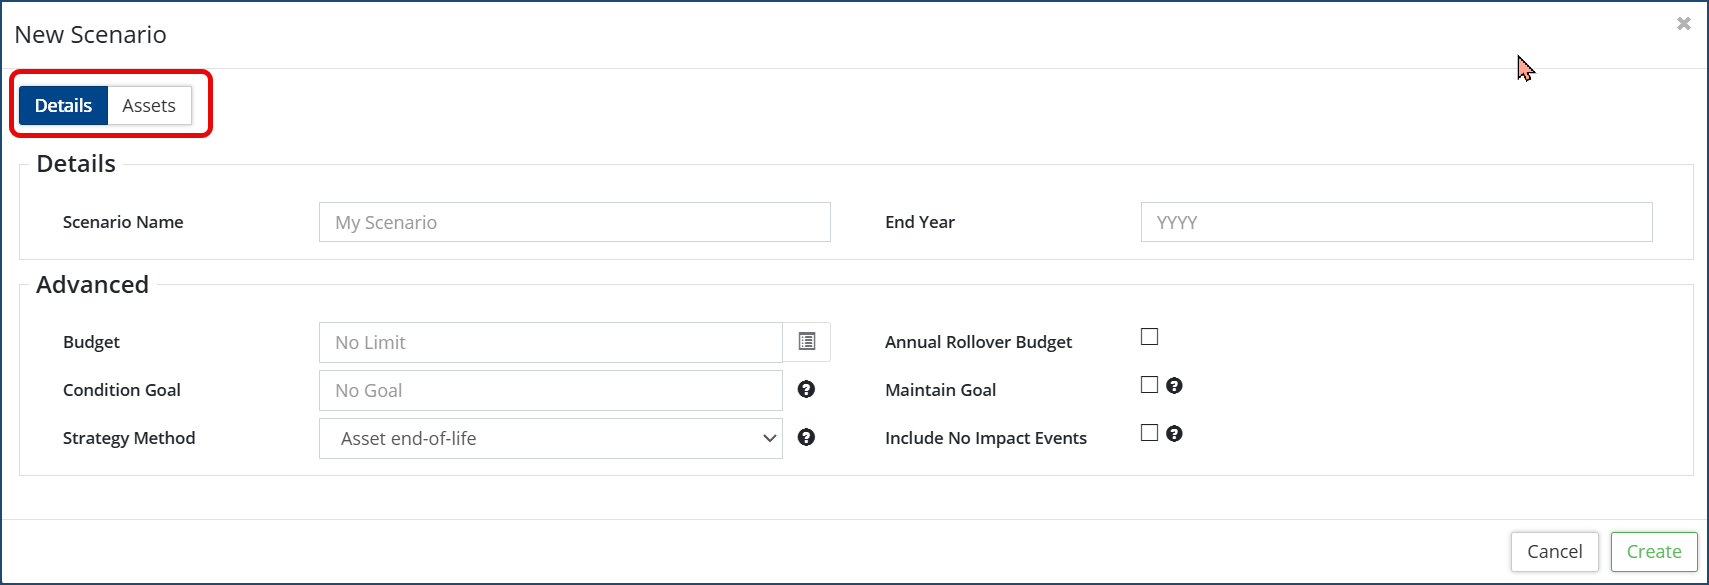
- Enter a Scenario Name and an End Year.
- Enter a Budget amount and check Annual Rollover Budget so that any leftover budget is pushed to the next year.
- Click Custom Budget
 icon to view/edit the budget for each year. If the End Year field is blank, the Custom Budget button is not available.
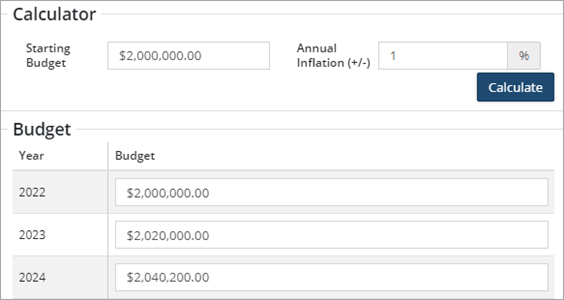
- When defining the budget for a scenario you can:
- Budget the same $ amount across multiple years
- Customize the budget for one year (i.e., $2,000,000 + grant $$) or all years
- Apply an Annual Inflation (+/-), click Calculate. The first year reflects the starting budget while each subsequent year has the inflation factor applied.
- When defining the budget for a scenario you can:
- Set a Condition Goal. The condition goal corresponds to the network average relative to the maximum condition of each asset. Check Maintain Goal if this scenario will only allocate budget to events while the average condition of the scenario is under the condition goal.
-
Setting a Condition Goal adds a line to the Condition graph that shows the distance from the condition goal year over year.
-
Selecting Maintain Goal will defer events when the condition goal has been reached for the year - ensuring the budget is used to achieve goals rather than overshoot them.
-
- Select the Strategy Method: Asset End of Life or Lifecycle EUL.
- Selecting Include No Impact Events will show No Impact Events in the Scenario and its reports.
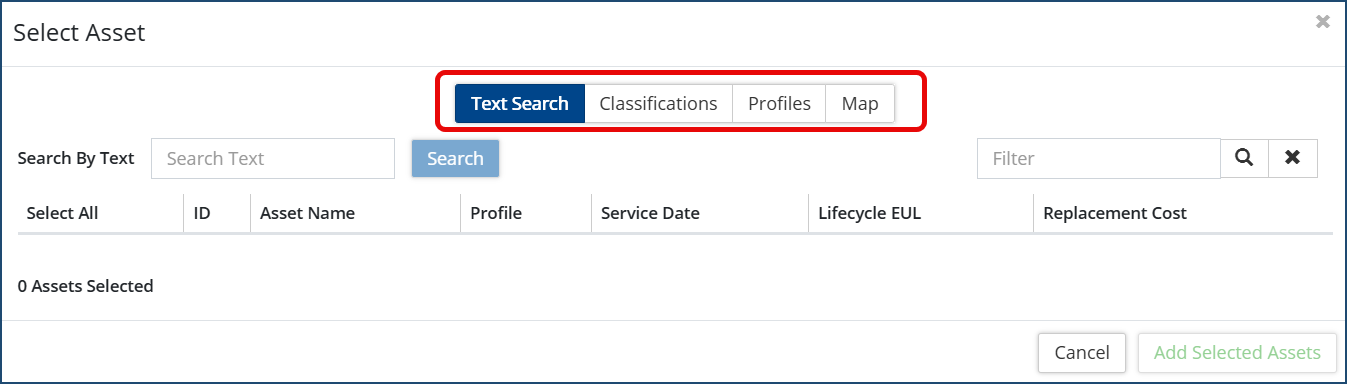
- Click Assets in the top left, select +Attach Assets .
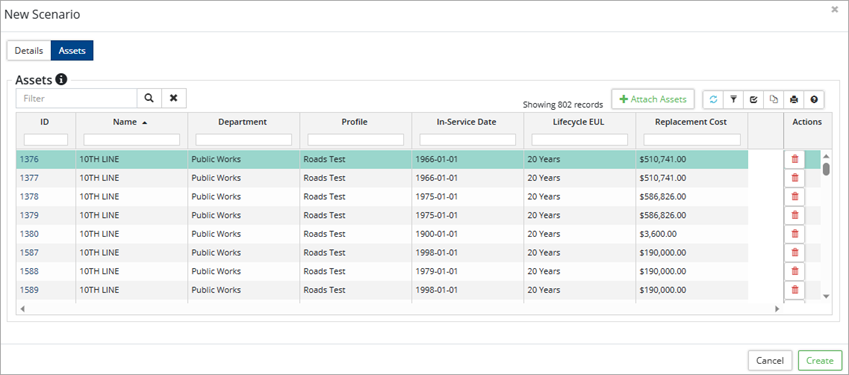
Assets can only be added if they have a valid lifecycle strategy, in-service date, are in the Active Inventory, and do not belong to the Default profile.
- Click a selection method, Text Search, Classifications, Profiles, or Map. Make your selections from the available drop-down list, and then click Search to load the assets.
 Replacement cost must be calculated on the assets. Assets without a replacement cost are excluded from the scenario.
 - Once loaded, filter the list as needed. Select individual assets or check Select All to add the assets to the new scenario.
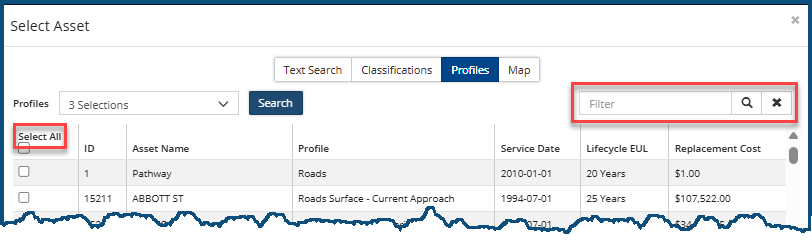
- Click Add Selected Assets .
- Once added, the Asset ID is linked, the grid can be sorted/filtered, and individual assets can be removed from the scenario by clicking on the right of the asset. Additional assets can be added with the +Attach Assets
Load times may be substantial depending on how many assets you decide to add. Our in-house tests produced the following averages time :
|
Asset Count |
Load Time |
|---|---|
|
2,000 |
60 s |
|
5,000 |
2.2 minutes |
|
~10,000 |
4.5 minutes |
|
12,000 |
5.7 minutes |
|
15,000 |
6.8 minutes |
14. Click Create .
Scenario Details
Once a Scenario is created, Citywide pulls the Condition, Risk and Event information from the Profile, as well as the individual assets, into the new scenario window.
Details
The Details screen shows the Run Date and summarizes scenario details. Here you can adjust the Scenario Name, End Year, Budget, Condition Goal, etc.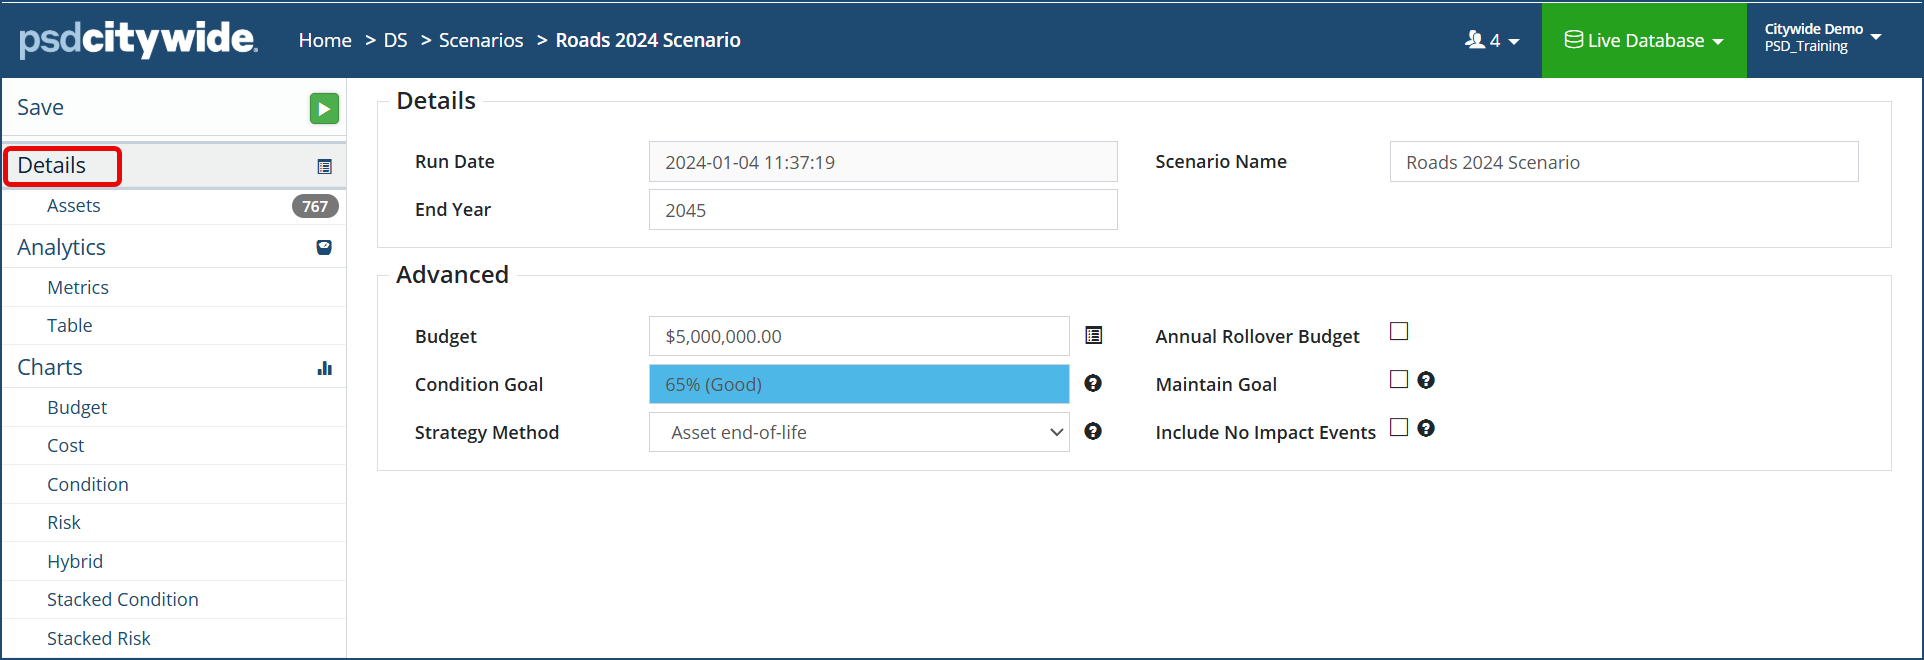
Assets
The Assets screen lists each asset and shows the Asset ID, Profile, In-Service Date, Lifecycle EUL, and Replacement Cost of the asset. Search and filter fields are available within the grid, as well as the delete button to remove individual assets from the scenario.
To drill down into the asset, click the Asset ID.
To create/save a custom view, click Customize Columns on the top right toolbar.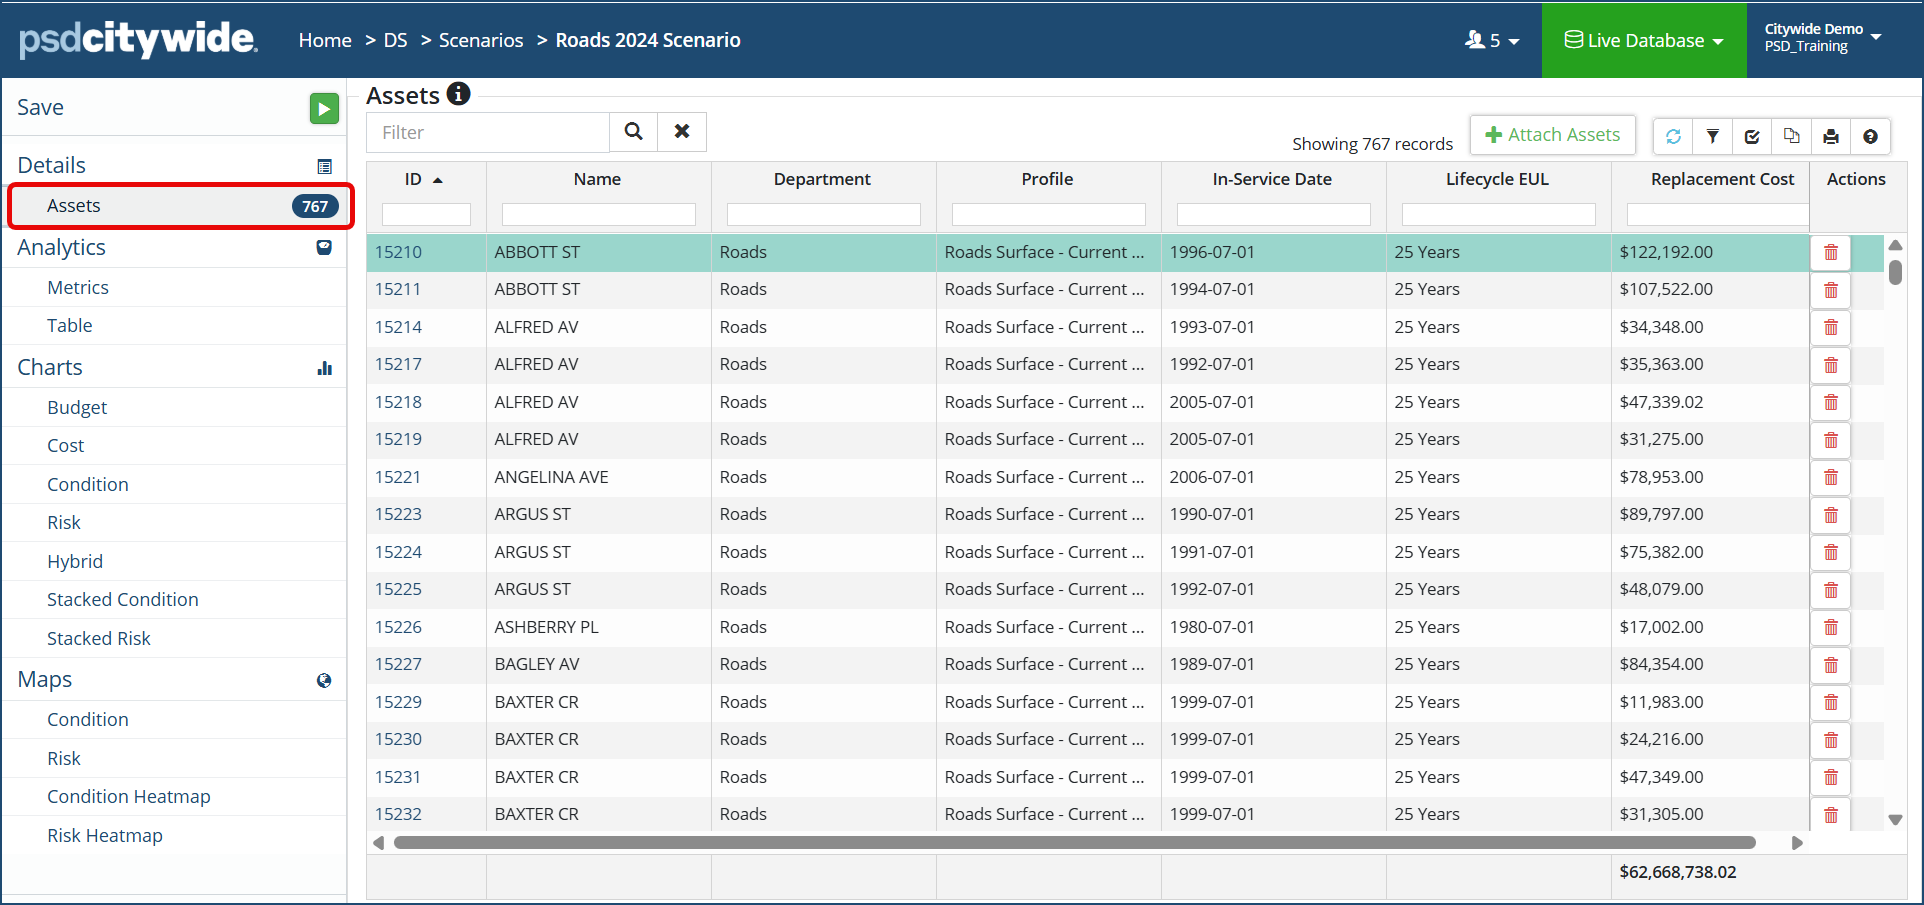
-
Multiple profiles of the same asset type or across asset types can be selected and included in a single scenario allowing you to look at co-ordinated projects across the board.
Analytics
The Metrics screen provides summary information and includes the Average Annual Spending, the Start/End Condition, as well as the Average Condition and Average Risk achieved for the assets in the scenario.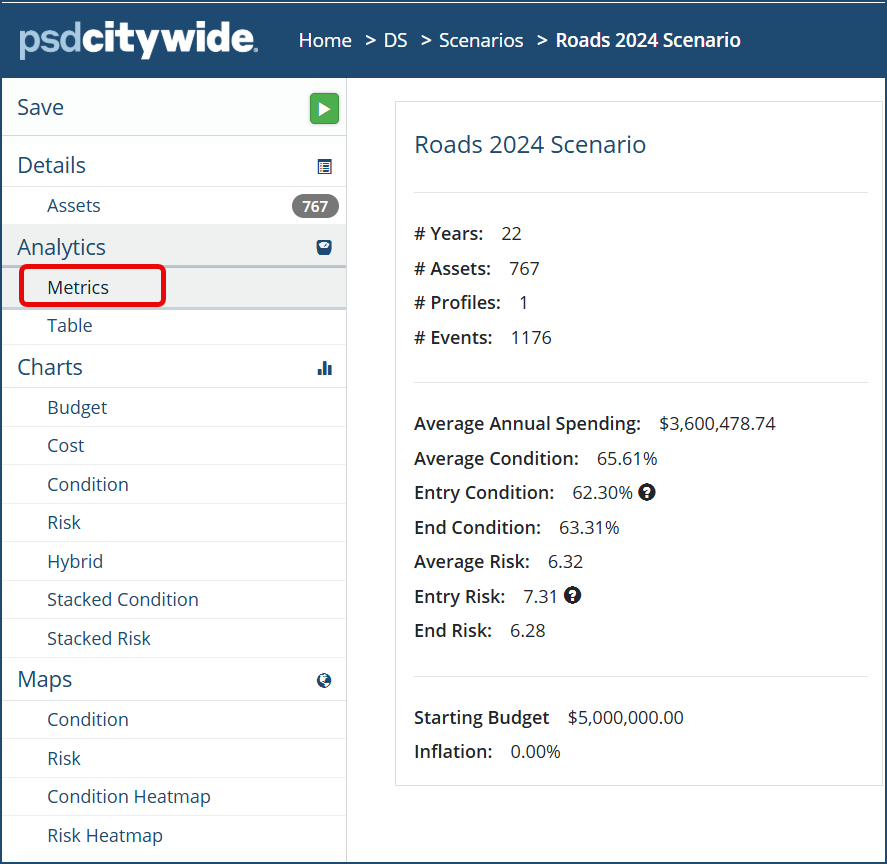
In the screenshot above, the scenario follows the lifecycle strategy as defined within the Profile(s) and applies the funding restriction to calculate an Average Annual Spend of approx. $3.6 million. This funding amount results in maintaining the 767 assets contained within the profile(s) at an average condition of 65.61% and an average risk of 6.32 over a 22-year period.
To optimize budget $$, if an asset’s condition and risk scores are above the Average Condition and Average Risk (as defined on the Analytics screen), any events that may have been scheduled for a particular year will be skipped on those assets. Decision Support will prioritize assets with the worst condition and highest risk.
-
In the background, Decision Support assigns a priority score to each asset based on condition and risk. Assets with the worse condition and highest risk will be ranked higher in priority. Decision Support then factors in the available funding and builds out a strategy of what events to do and on which assets based on assigned priority levels.
The Table screen shows the analyzed data that supports the visualization Charts. It displays detailed information (view condition, risk or both) for each asset added to the scenario and its progression to the end year specified in the details. This table data can also be exported to Excel ![]() as needed.
as needed.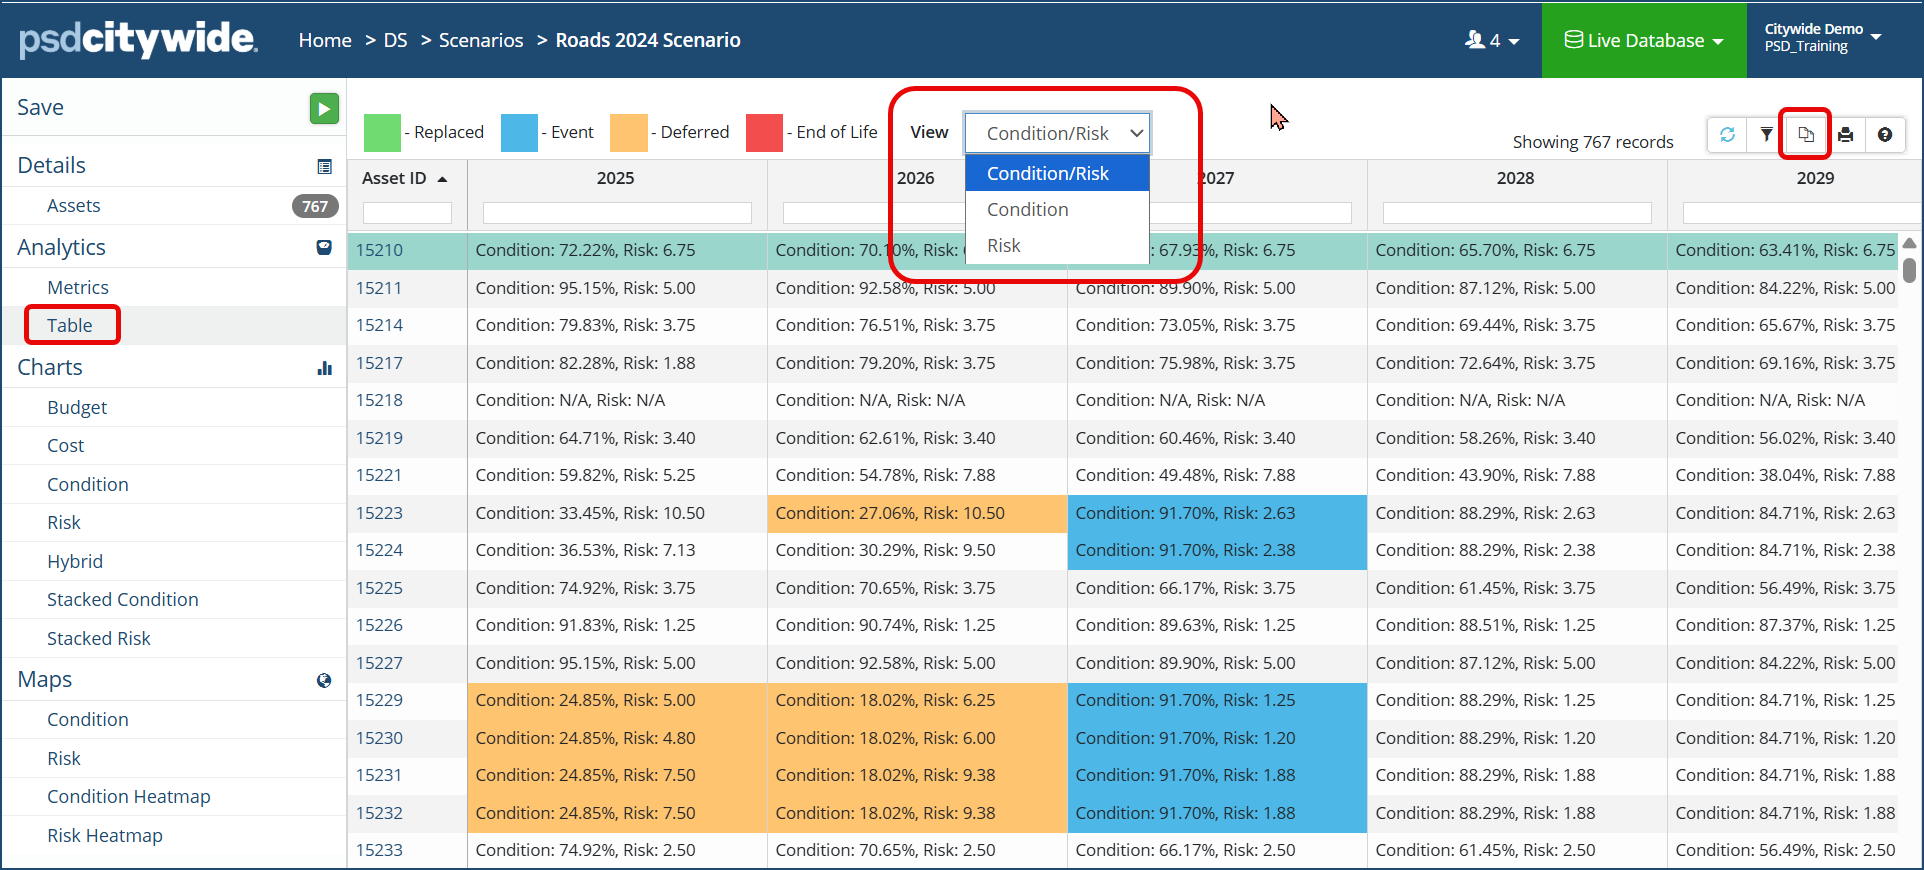
The Charts section provides several data charts (i.e., Budget, Cost, Condition, Risk, etc.) showing analyzed data within the scenario and how it is trending. Charts show the impact the level of funding has on the assets for the profile(s) used to create the scenario. Click each screen to access chart information.
|
|
|
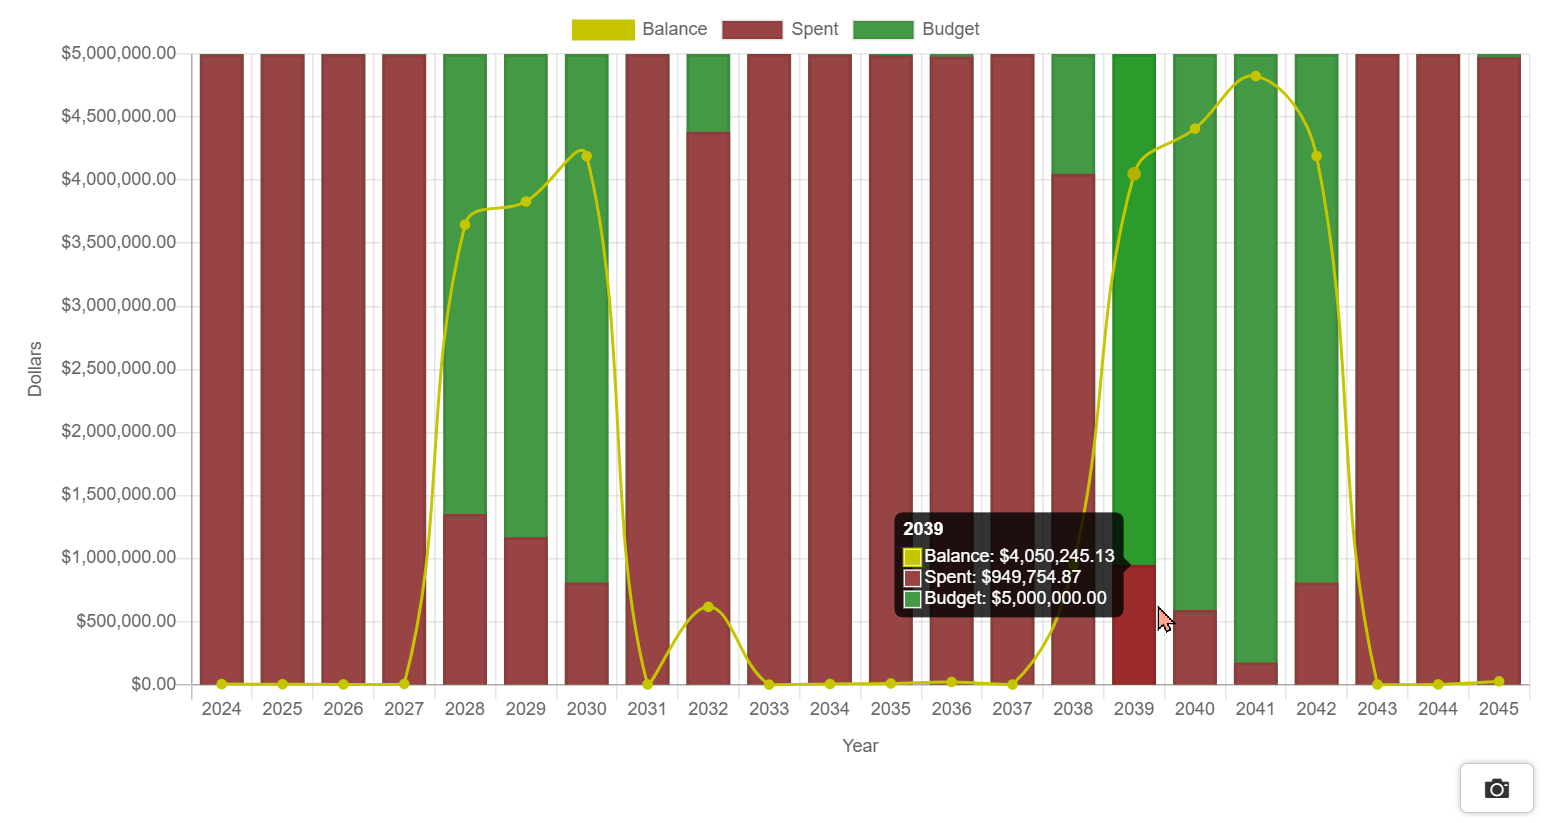 |
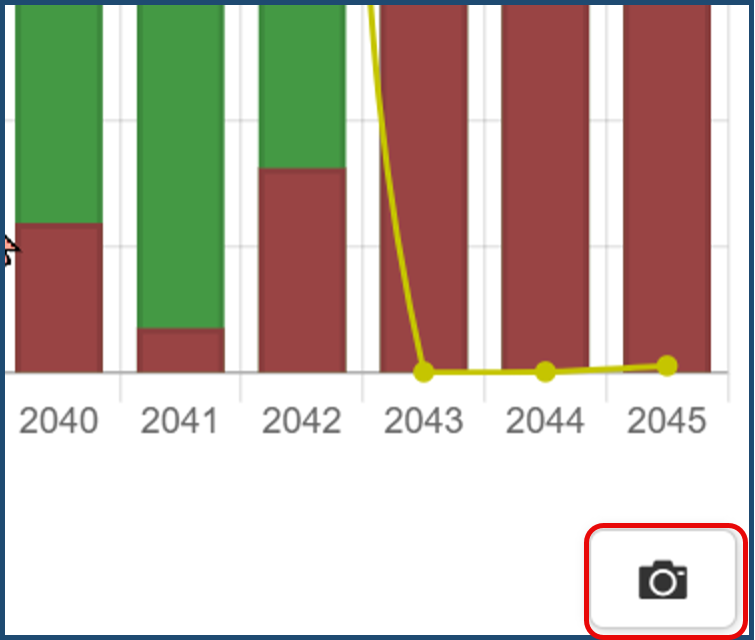
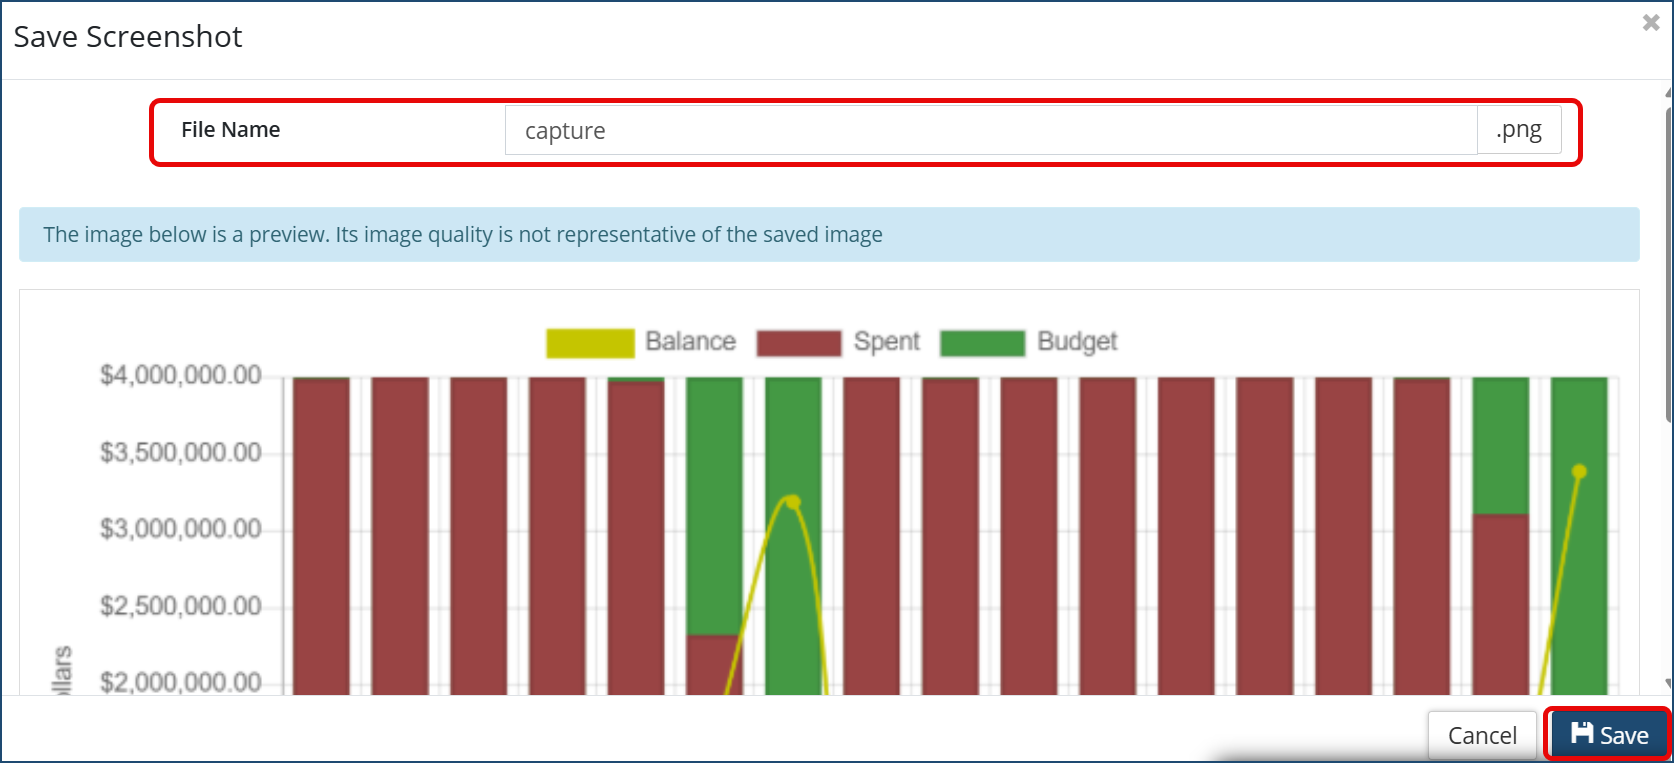
Budget shows if spending is trending upwards or downwards year after year. Hover over a column to see Balance, Spent, and Budget data. |
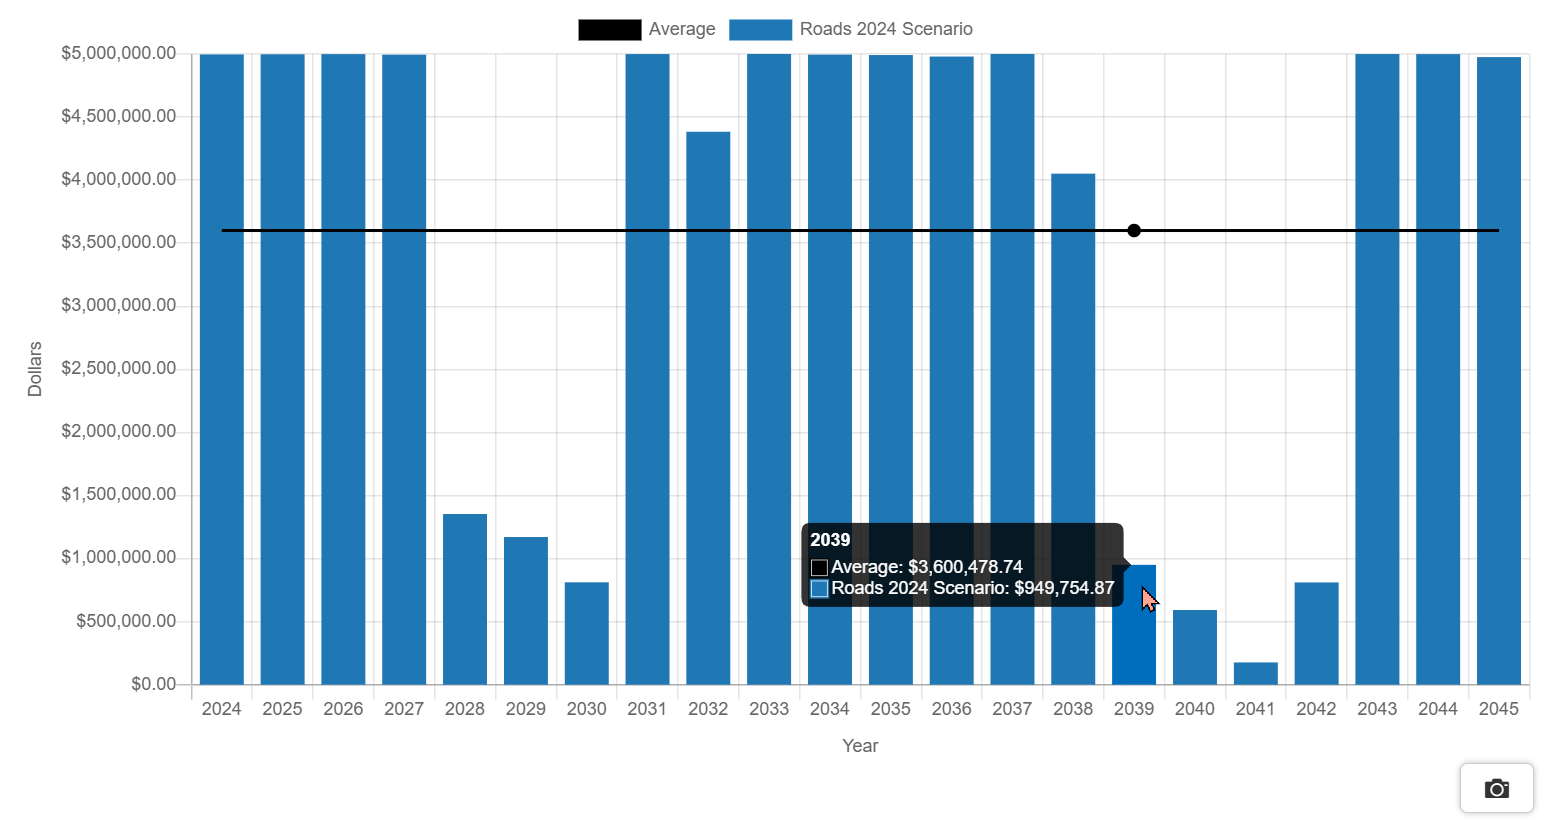 |
Cost compares the Average Annual Spending amount to the actual budget $$ spent year after year. Hover over a column to see the average annual spending vs the actual cost. |
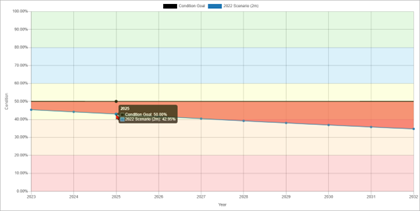 |
Condition shows the condition of the assets trending up or down within the scenario. A goal line is added if a Condition Goal has been set (Details page), and colours the graph above and below the goal value to emphasize the distance from the goal year over year. Hover over a marker to see the average condition value for the year. If the trendline is displaying in the red or orange portion of the grid, this indicates the assets are in poor to very poor condition, on average. The colours of the grid match the condition range set in the Profile used for the scenario. |
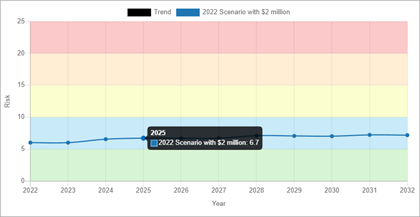 |
Risk shows the risk of the assets trending up or down within the scenario. Hover over a marker to see the average risk value for the year. If the trendline is displaying in the green or blue section of the grid, then the risk of the assets failing, on average, is low. |
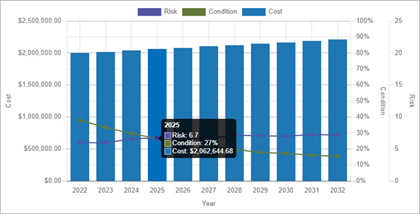 |
Hybrid shows how Risk, Condition, and Cost are trending within the scenario. Hover over a marker to see risk and condition values, as well as cost for the year. |
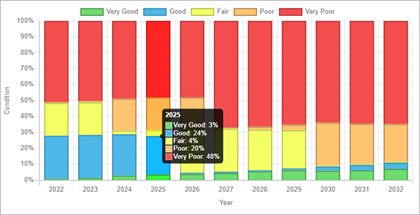 |
Stacked Condition shows the percentage of assets that fall in each tier of the condition range (i.e., Very Good to Very Poor). Hover over a column to see percentage information for the year. |
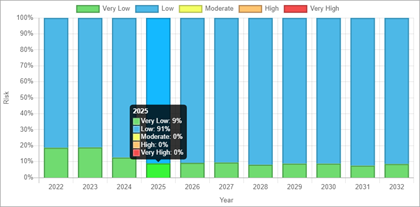 |
Stacked Risk shows the percentage of assets in each tier of the Risk categories (i.e., Very Low to Very High). Hover over a column to see percentage information for the year |
Copy or Save Image
Any of the visualization charts can be saved as a .PNG file:
- Select a chart
- Click on the camera icon at the bottom right corner of the chart
 .
. - Type a file name and then click Save.
Maps
The Maps section provides a visual depiction of the assets and their Condition or Risk rating on an actual map. Integration between Citywide Assets and GIS is required for the mapping tool to work. If an integration does exist, the Maps section provides a visualization of the assets and their condition or risk in real time. A video time lapse shows how the assets will change over the course of several years. Use the map tool to:
- See colour-coded assets showing the impact the scenario has on condition/risk
- Play a time-lapse video showing how the assets’ condition/risk will change over time
- Identify areas on the map where assets are generally in poorer condition and/or have a higher risk of failing
Condition
Assets display on a map with condition formatting applied. For example, assets in very poor condition display in red, fair condition display in yellow, good condition display in blue, etc. A video timelapse shows how the strategy will impact the assets within the scenario over the course of several years.
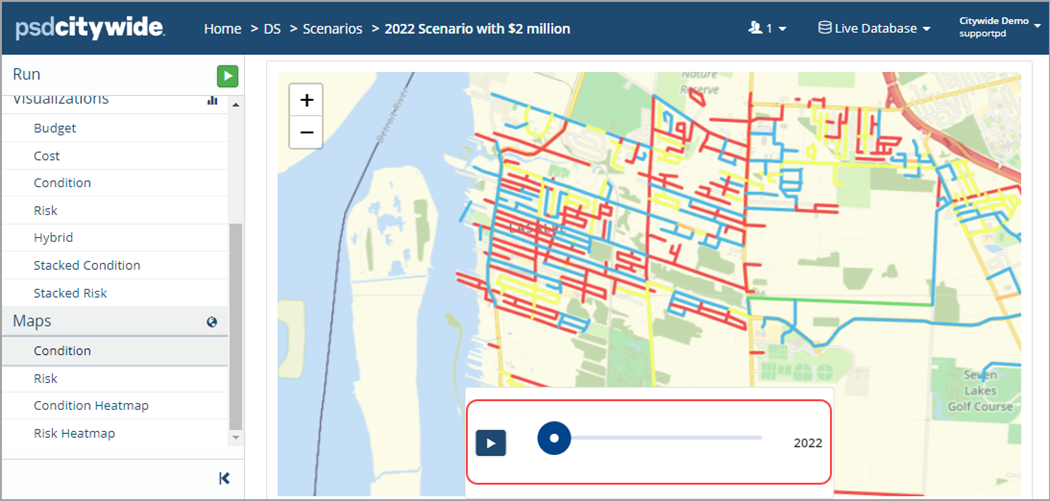
Zoom into an area of the map to see how the scenario’s strategy will impact the condition of assets within a specific neighborhood or community over the years defined within the scenario.
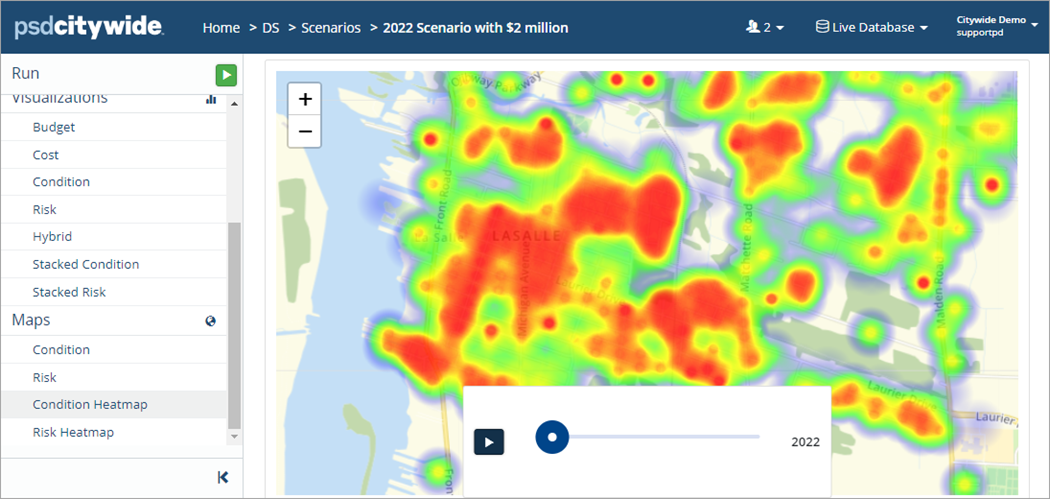
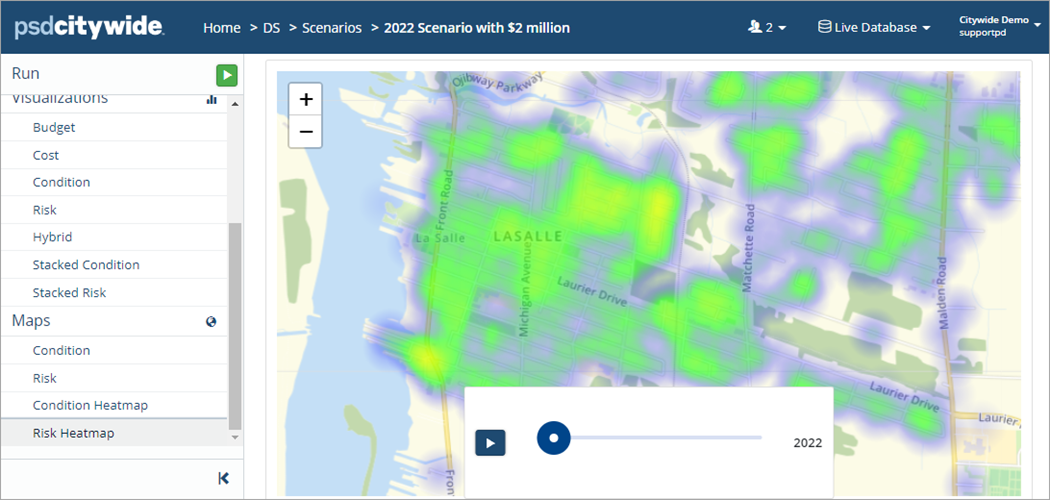
Heatmaps
Heatmaps are another tool available to visualize data and identify areas with poorer condition or higher risk. A video time-lapse is also available to see how condition and risk change over time.
Condition Heatmap
Risk Heatmap
Edit, Delete or Copy a Scenario
Edit a Scenario:
Details such as the scenario name, funding amount, end year, etc. can be modified
- Open a Scenario. The Details screen displays.
- Enter your changes.
- Click Save at the top of the Navigation pane.
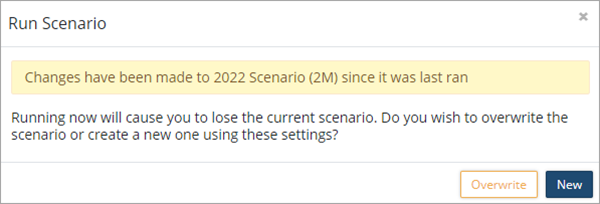
- Click Overwrite to update the scenario with the new information. Or click New to create a new copy of the scenario with the updated information.
-
When a scenario is created it captures the information in the profile of the attached assets. If the profile is changed, the scenario will continue to run based on the original definition of the profile unless the scenario is updated using Save/Overwrite. The advantage of not refreshing a scenario once the associated profile has been modified is that it allows for the comparison of the same assets using different strategies.
Delete a Scenario:
- Navigate to the Scenarios screen and locate the scenario within the grid.
- Click Delete
 on the right.
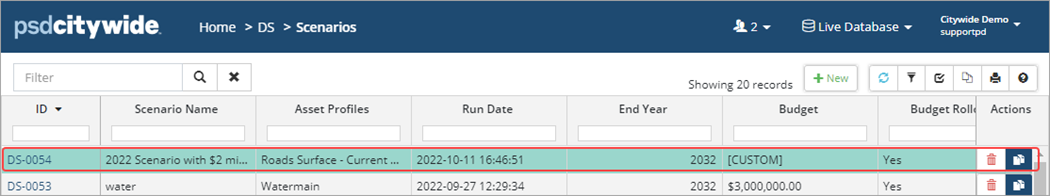
- Click Remove in the Remove Scenario prompt.
Duplicate (Copy) a Scenario:
Create multiple scenarios to see how different funding amounts impact the condition and risk of the assets, therefore affecting levels of service. For example, council may want a group of assets maintained at a 60% condition rating over a 10-year period. Create multiple scenarios with different funding sources to determine what the average annual spend will need to be to achieve the desired goal. A quick way to create a new scenario is to duplicate an existing one.
There are two ways to duplicate a scenario.
- Edit the details of an existing scenario and then click Run (see Edit a Scenario above)
- Click the Copy button on the Scenarios grid
- Navigate to the Scenarios screen and locate the scenario within the grid.
- Click Copy
 on the right.
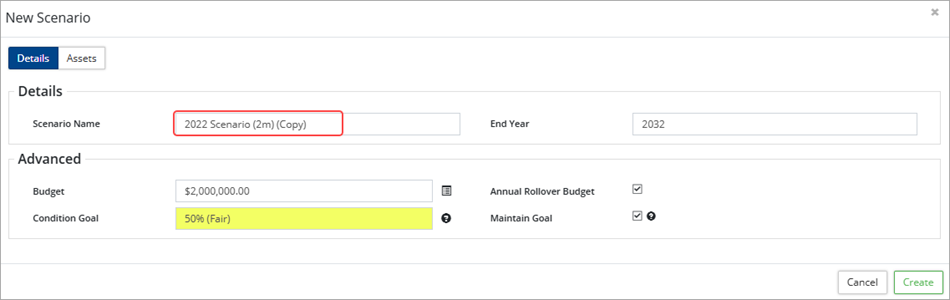
- In the New Scenario window adjust the Name and Budget.
- Click Custom Budget
 to adjust the funding amount.
 - Click Create . The new scenario displays.
- Review Analytics, Visualizations, and Maps to see the new strategy.