This section describes the mathematical equations and comparative logic used to generate Scenarios in Citywide Decision Support (DS). The content below has been created and maintained to mirror math that was committed into our code base.
Prioritization and Event Cost Efficiency
When a Scenario is generated for a set of assets, DS looks at the Asset Events that could take place in each given month and orders them based on event priority and cost efficiency.
The order of priority goes:
- Replacement Events
- Previously Deferred Events
- Expected Events
- No Impact Events (which can be toggled on or off at the creation of the scenario)
Within that sequence events are ordered by their cost efficiency. Simply put, the cost efficiency of an asset’s event is the increase in condition, which is normalized to a common value, then weighed by that asset's replacement cost, then related to event cost for an increase per dollar value.
Granted Rulings
The following distinctions are taken as granted within Decision Support while it runs the logic and formulae specified in this document. These rulings work together to ensure that DS works properly as a unique application and so may differ slightly from comparable areas of Citywide Assets.
- Scenarios start in the current calendar year - not in the inventory year
- Condition in the first Scenario year is a projection of existing Condition Assessments where possible to the end of the Scenario year
- The strategy method is chosen at the creation of the scenario:
- The Asset end of life strategy uses the Valuation EUL for EUL calculations if available, then Lifecycle EUL Override or Lifecycle EUL if not prior to the first Replacement
- The Lifecycle EUL strategy uses the Lifecycle EUL Override for EUL calculations if available, then Lifecycle EUL or Valuation EUL if not
- Scenarios commit only one Impactful Event per Asset per month
- No Impact events are included if checked 'yes' at the creation of the scenario and are committed immediately without affecting budget or event timing
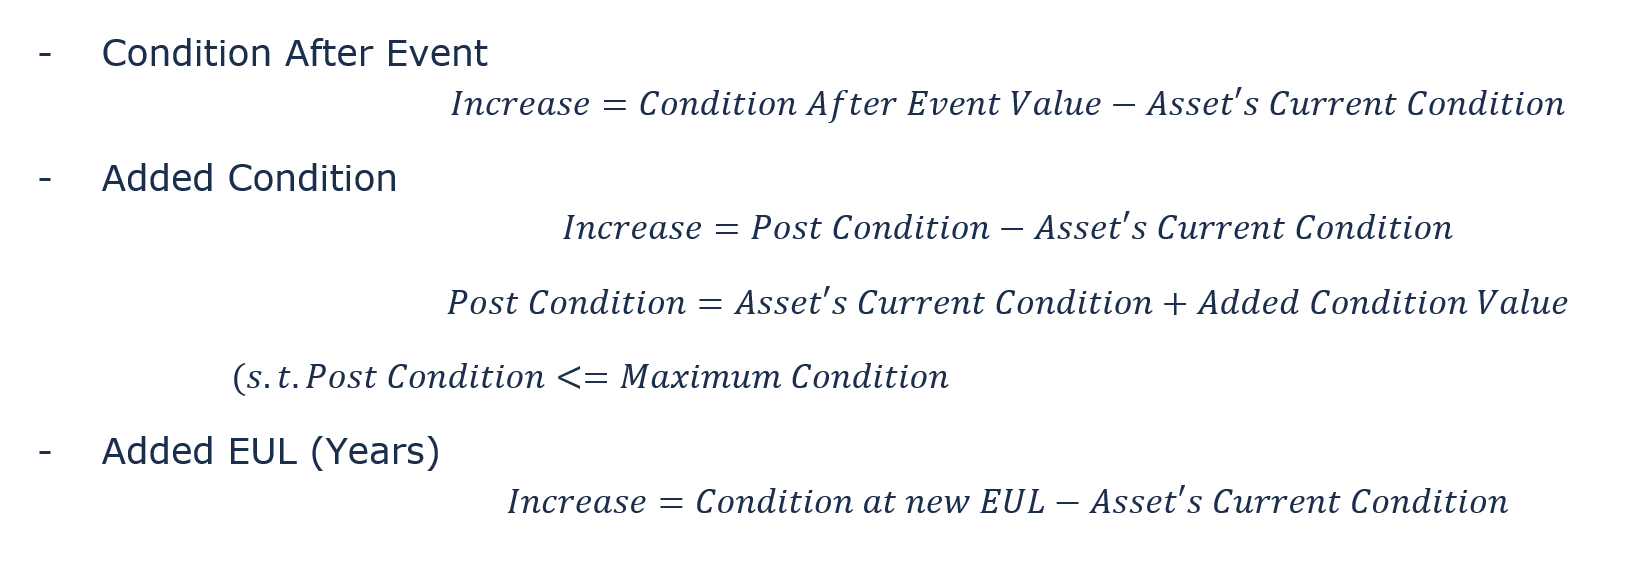
Calculating Cost Efficiency
Increase in Condition
This is the value difference between the asset’s condition before the event and after the event and is based on the type of event chosen.
Normalization
These condition increases are normalized to a range of 0 to 100 based on their max condition.
![]()
Weighing by Replacement Cost
Each normalized condition increase is multiplied by the ratio between the asset’s replacement cost to the total replacement cost of assets in the Scenario.
![]()
This ensures that events which improve the condition of expensive assets are of a higher priority than a similar event on a less expensive asset.
Event Cost
The final step DS takes to determine event cost efficiency is to divide the weighted increase in condition by the total cost for that event.
![]()
This ensures that cheaper events are of a higher priority than a similar event that is more expensive.
Example Cost Efficiency
Assume you run a Scenario with 2 assets, each with an event on the given month, but with only enough budget in the Scenario to perform 1 event - which one would get chosen?
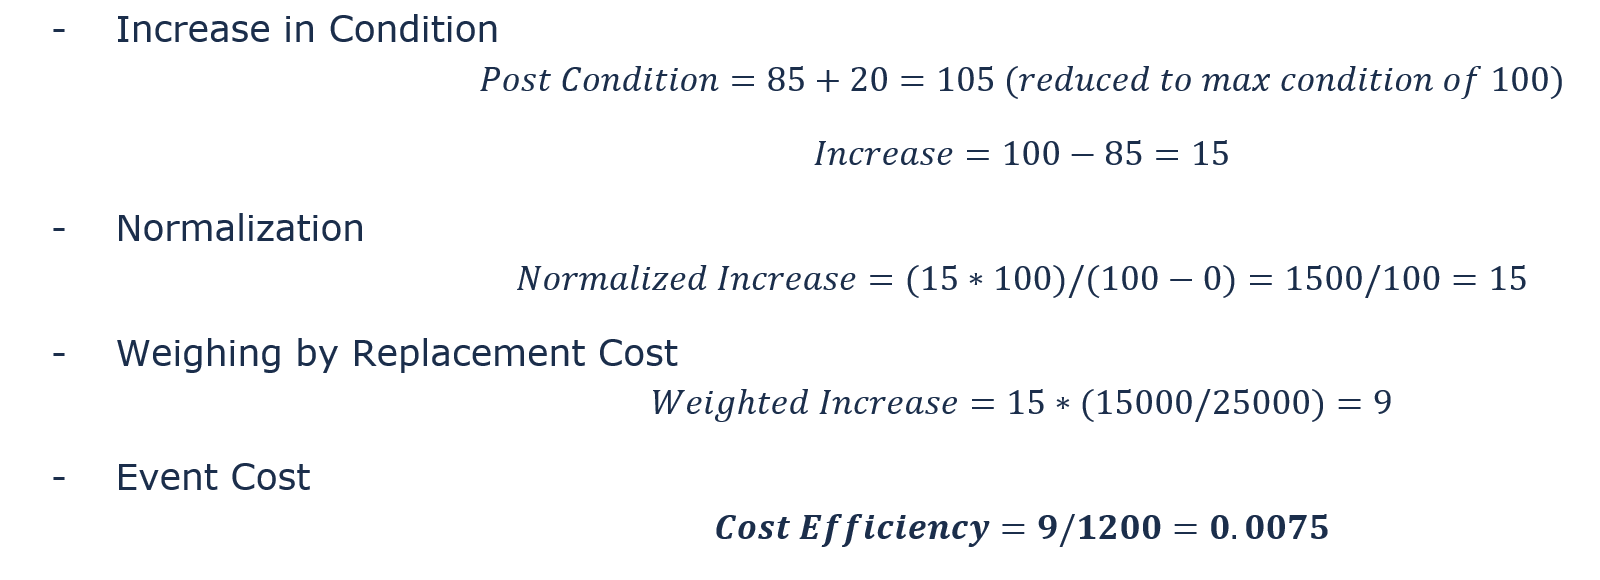
Asset A
- Replacement Cost = $15,000
- Current Condition = 85 (scaled 0 to 100)
- Event Type = Added Condition
- Event Value = 20 (scaled 0 to 100)
- Event Cost = $1,200
Asset B
- Replacement Cost = $10,000
- Current Condition = 3 (scaled 0 to 10)
- Event Type = Condition After Event
- Event Value = 7 (scaled 0 to 10)
- Event Cost = $2,000
Calculate Cost Efficiency of Asset A’s Event
Calculate Cost Efficiency of Asset B’s Event
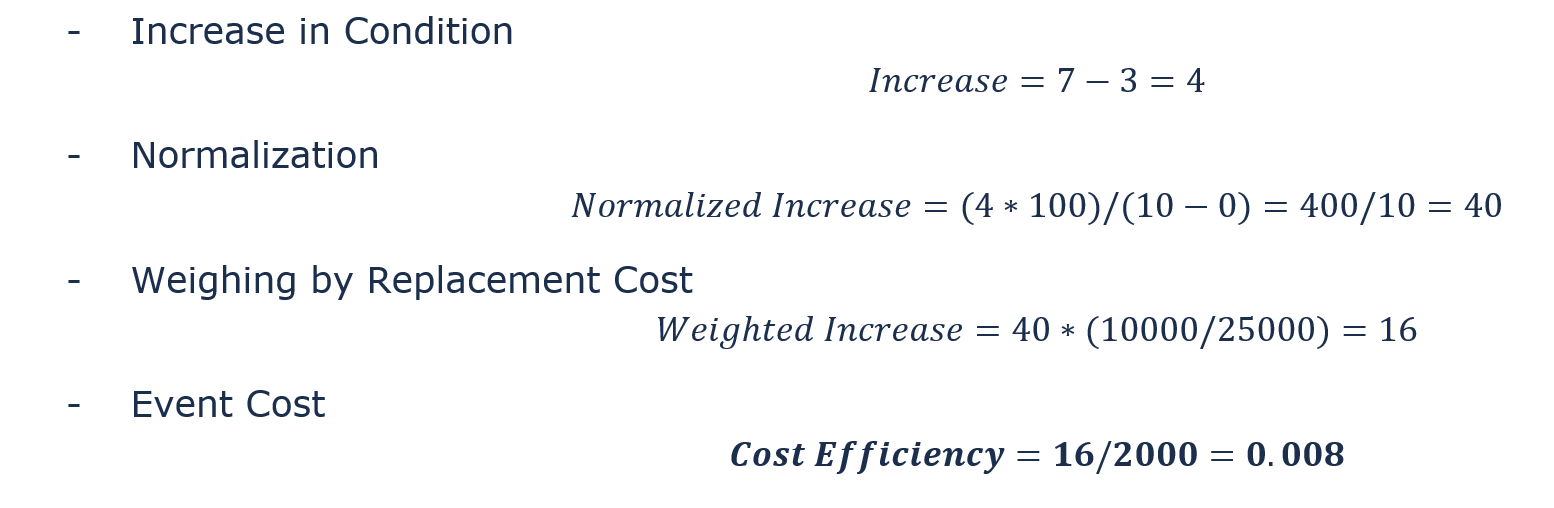
Answer: Asset B’s event will be done. This is because the cost efficiency value of 0.008 is higher than 0.0075 (Asset A).
Lifecycle Deterioration
In a Decision Support Scenario, assets deteriorate each month based on the deterioration curve selected for that asset. This deterioration is calculated at specific moments during the construction of a Scenario in order to maintain accuracy.
Deterioration curves are graphable equations that relate the age of an asset to its projected condition - such that the condition reaches 0 at the end of the asset’s useful life. To be a universal equation, the age and condition used are ratios representing how close an asset is to its maximum age or maximum condition respectively.
Age Ratio
A value between 0 and 1, where 1 is the maximum age of the asset
![]()
Condition Ratio
A value between 0 and 1, where 1 is the maximum condition of the asset
![]()
Deterioration Curve Equations
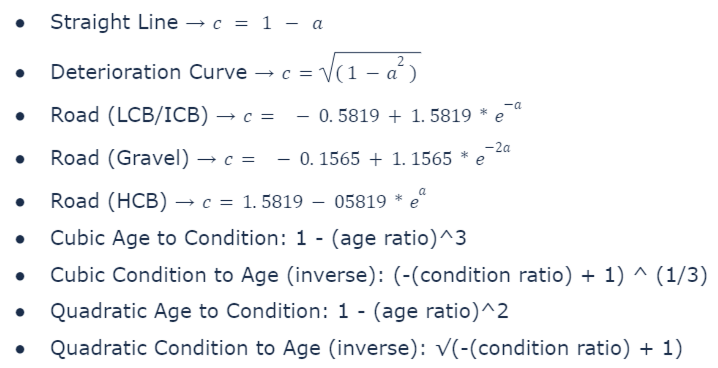
Decision Support Deterioration Calculations
DS calculates deterioration in 2 instances.
At the start of each month, DS deteriorates each asset to the end of the month to compose the network average condition. This value is used later in logic concerning “Maintain Goal”.
After each event is applied, DS applies the condition increase then deteriorates the asset in question to the end of the month. This is re-compared to the network average and used late in logic concerning “Maintain Goal”.
Network Average and Maintain Goal
The primary feature of DS v2 is the ability to solve for target Condition using Maintain Goal along with a defined Condition Goal.
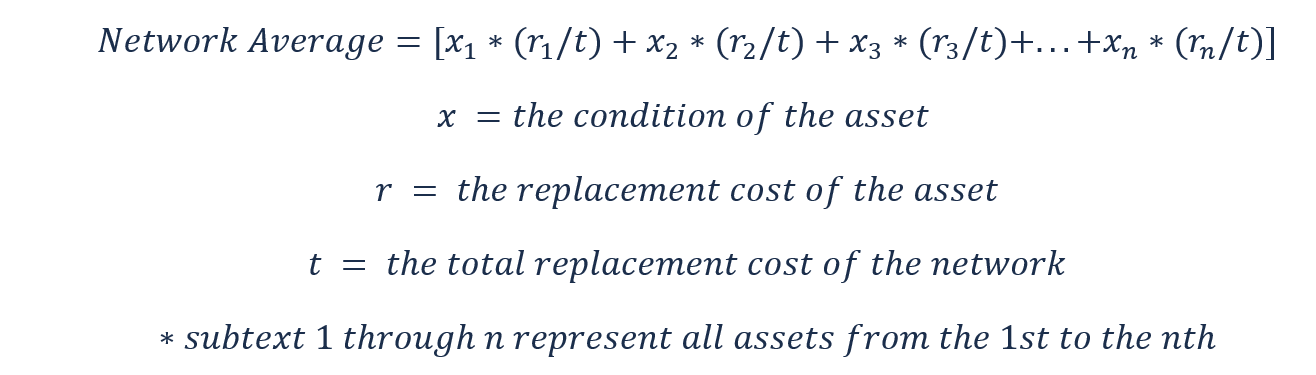
Fresh Network Average Condition
At the start of each month in DS, the network average for the end of the month is calculated. If this average is below our Condition Goal, then the next priority Event is committed.
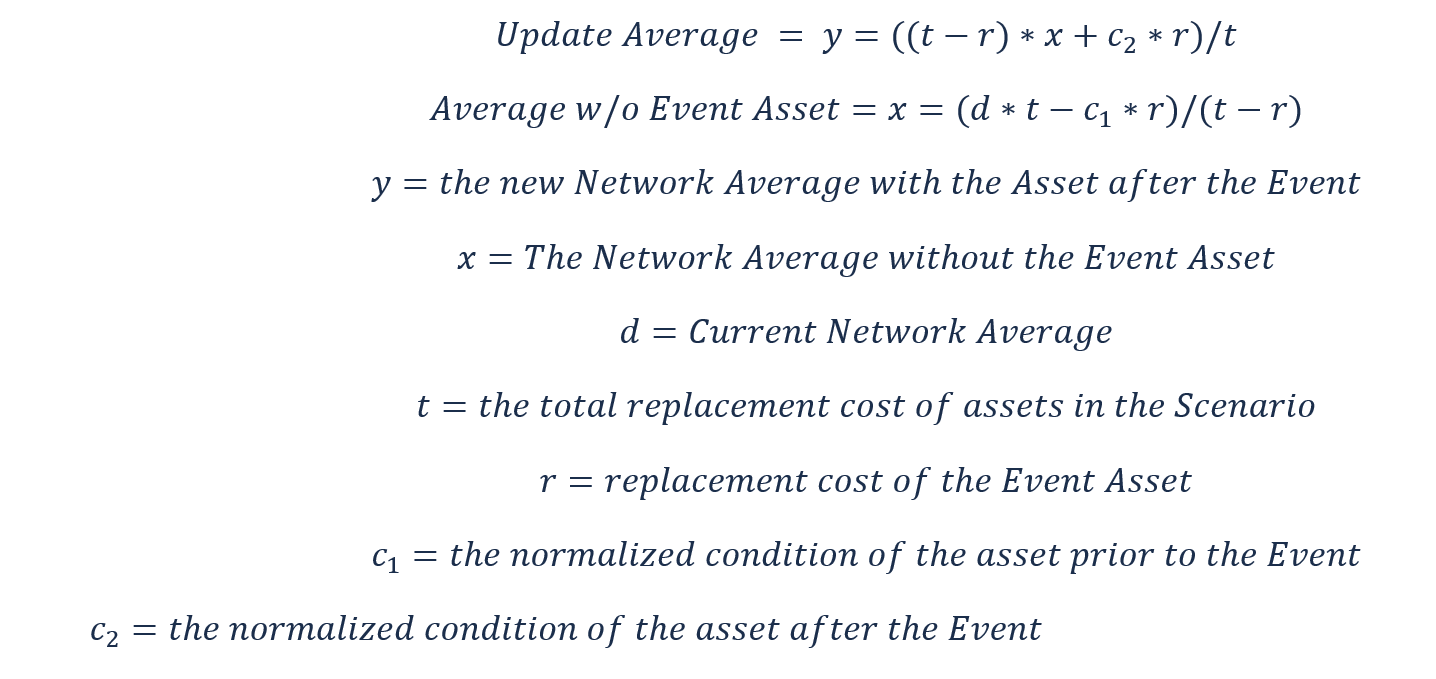
Updated Network Average Condition
Whenever an Event is committed to being done in a Scenario, that Asset is deteriorated to the end of the month, and the network average is recalculated. This update calculation is a derivation of the “Fresh Network Average Condition” that allows us to access less data points - thus speeding up Decision Support.
This works by finding what the Network Average would be without the Event Asset by assuming a standard condition on the remaining assets that make the Average possible. Using that value, we can compute the updated average by subbing in the Event Assets new condition. Doing this, it is as easy to recalculate the average of 1000 assets as it is 2 assets
Example Fresh Network Average
Suppose you run a Scenario with 3 Assets with the below Condition and Replacement Cost. The Condition Goal is 65 - should an Event be committed this month?
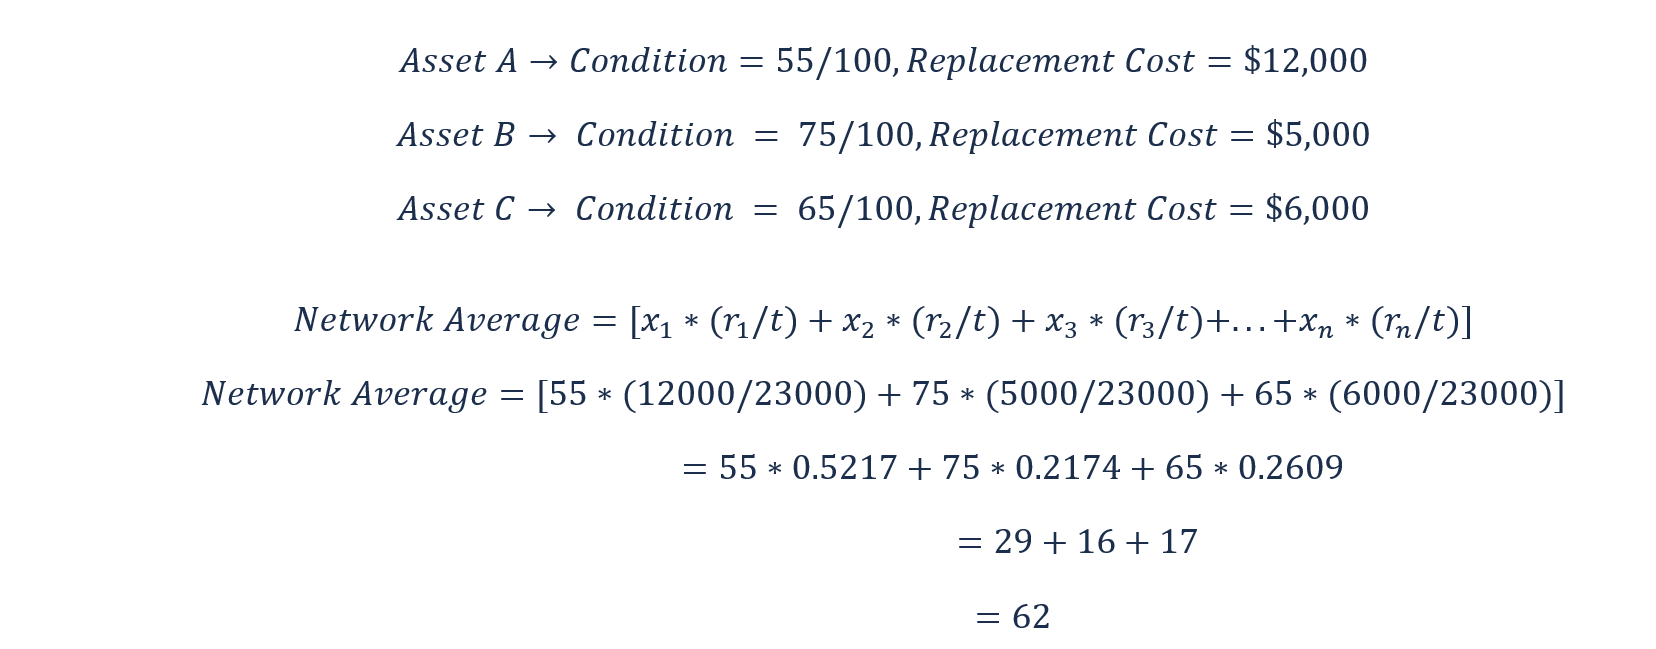
Answer: Because the Network Average of 62 is lower than our Condition Goal of 65, an Event should be committed this month.
Example Updated Network Average Condition
Suppose that Asset A in the previous Scenario has an Event committed that increases its condition by 25 - should another Event be committed this month?
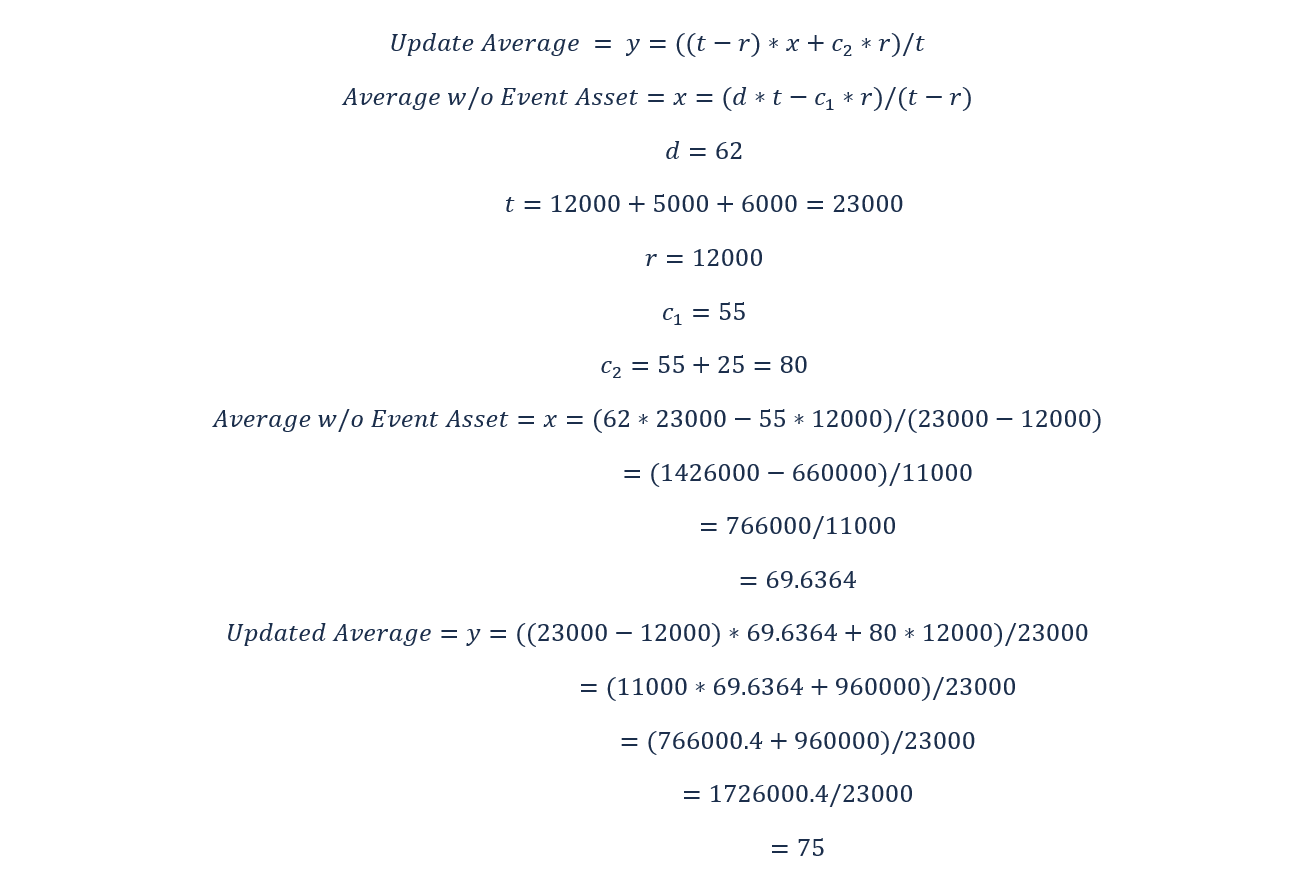
Answer: Because the Updated Network Average of 75 is higher than our Condition Goal of 65, no more Events should be committed this month.
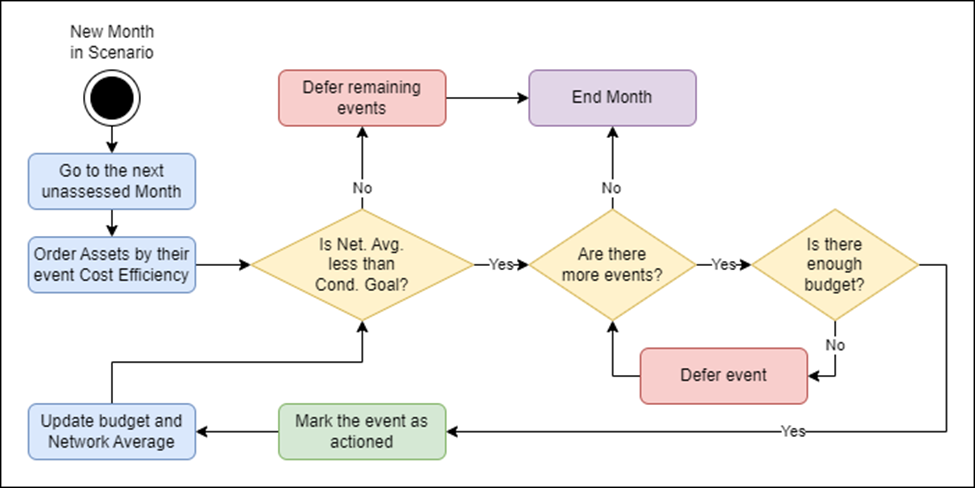
Step-by-Step Logic for Maintain Goal
The logic for Maintain Goal follows a set of steps and checks that either complete or defer Events based on how the current Network Average measures up against the Condition Goal.
Each month DS orders the Assets by the Cost Efficiency of their Events, and calculates the Network Average for the end of the year. Provided the Network Average is under our Condition Goal, DS attempts to commit the next prioritized Asset Event to be committed. Once an Event is committed, the budget is adjusted accordingly, the Network Average is recalculated, and the cycle repeats.
If there is not enough budget in the Scenario for an Event, that event is deferred and the next Event is checked. If after an Event the Network Average is above the Condition Goal, all remaining events are deferred for the month. If after an Event there are no more Events remaining, DS moves onto the next month and starts the cycle over again.