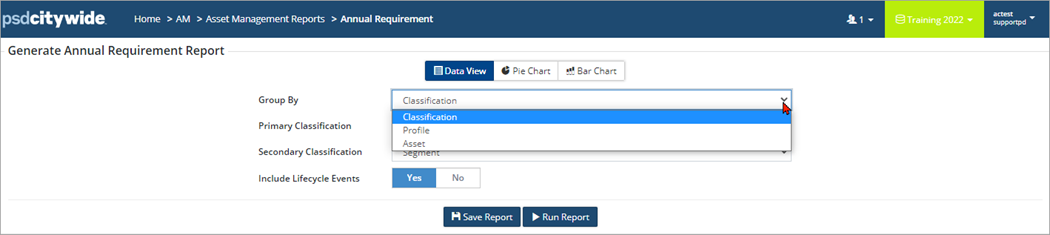
The Annual Requirement report provides a summary of the average yearly investment amount needed to maintain infrastructure, and includes Lifecycle Events by default. A cumulative total is included at the bottom of the report. Data can be grouped by Classification, Profile, or Assets.
|
Report Type |
|
|
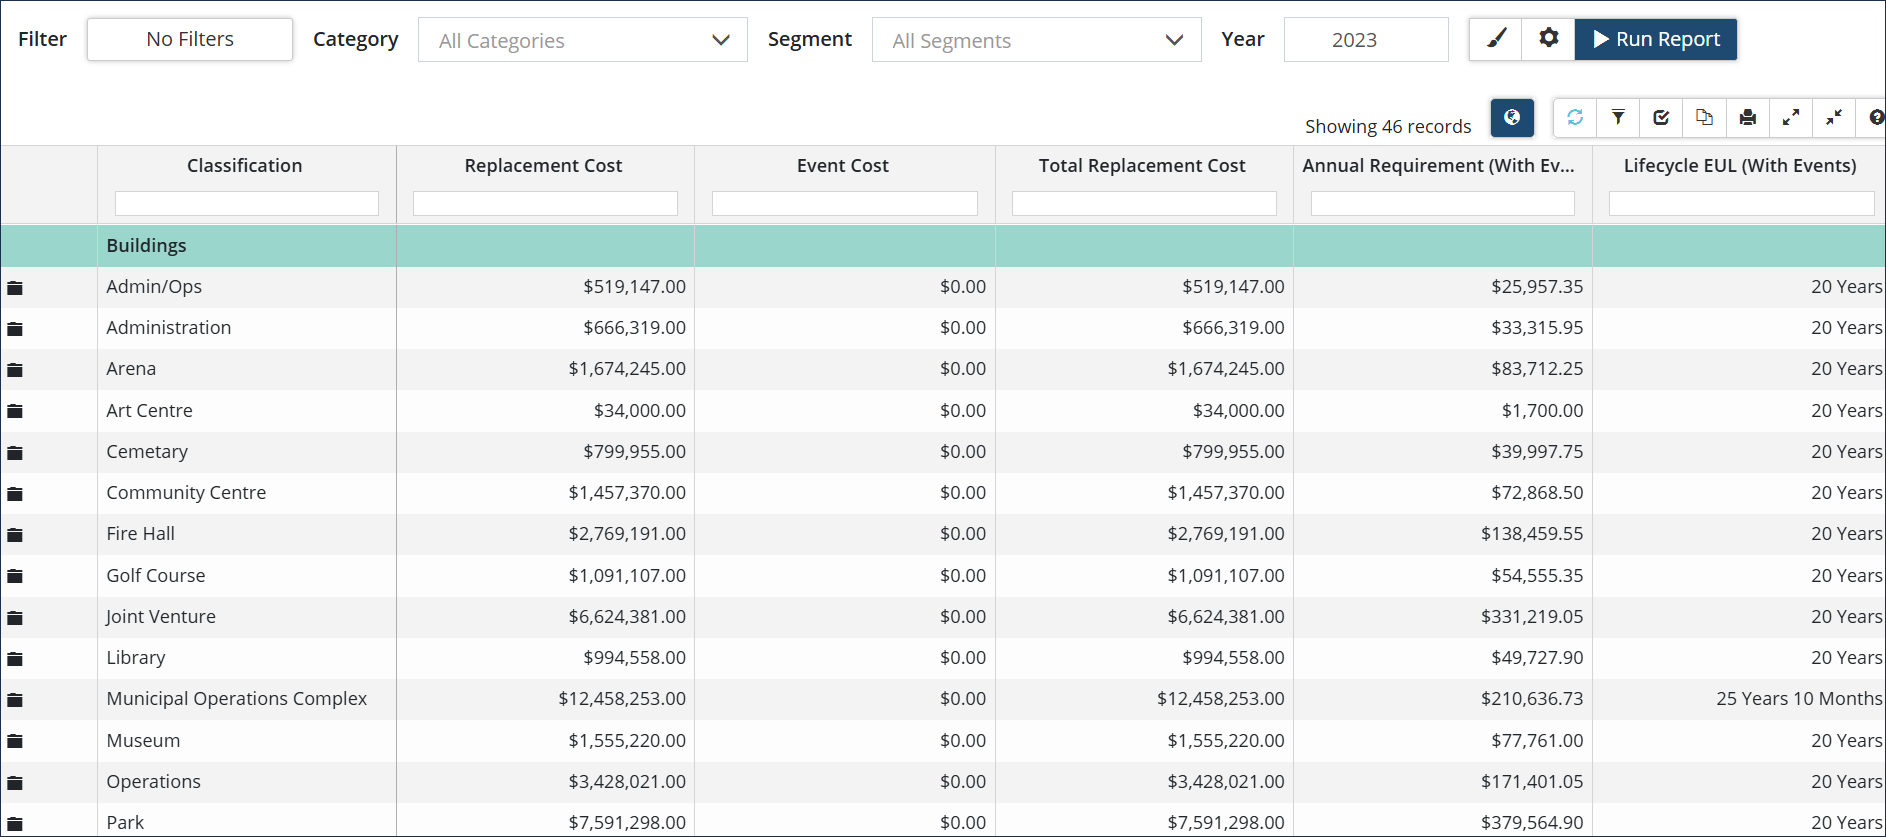
Data View: Classic report view with data grouped by Profile or Classification and includes a cumulative total. The Include Lifecycle Events flag controls whether Event Costs will be included in the report output. If set to Yes, the output will show lifecycle strategy events, including asset replacement events, that have been identified for the reporting year. |
 |
|
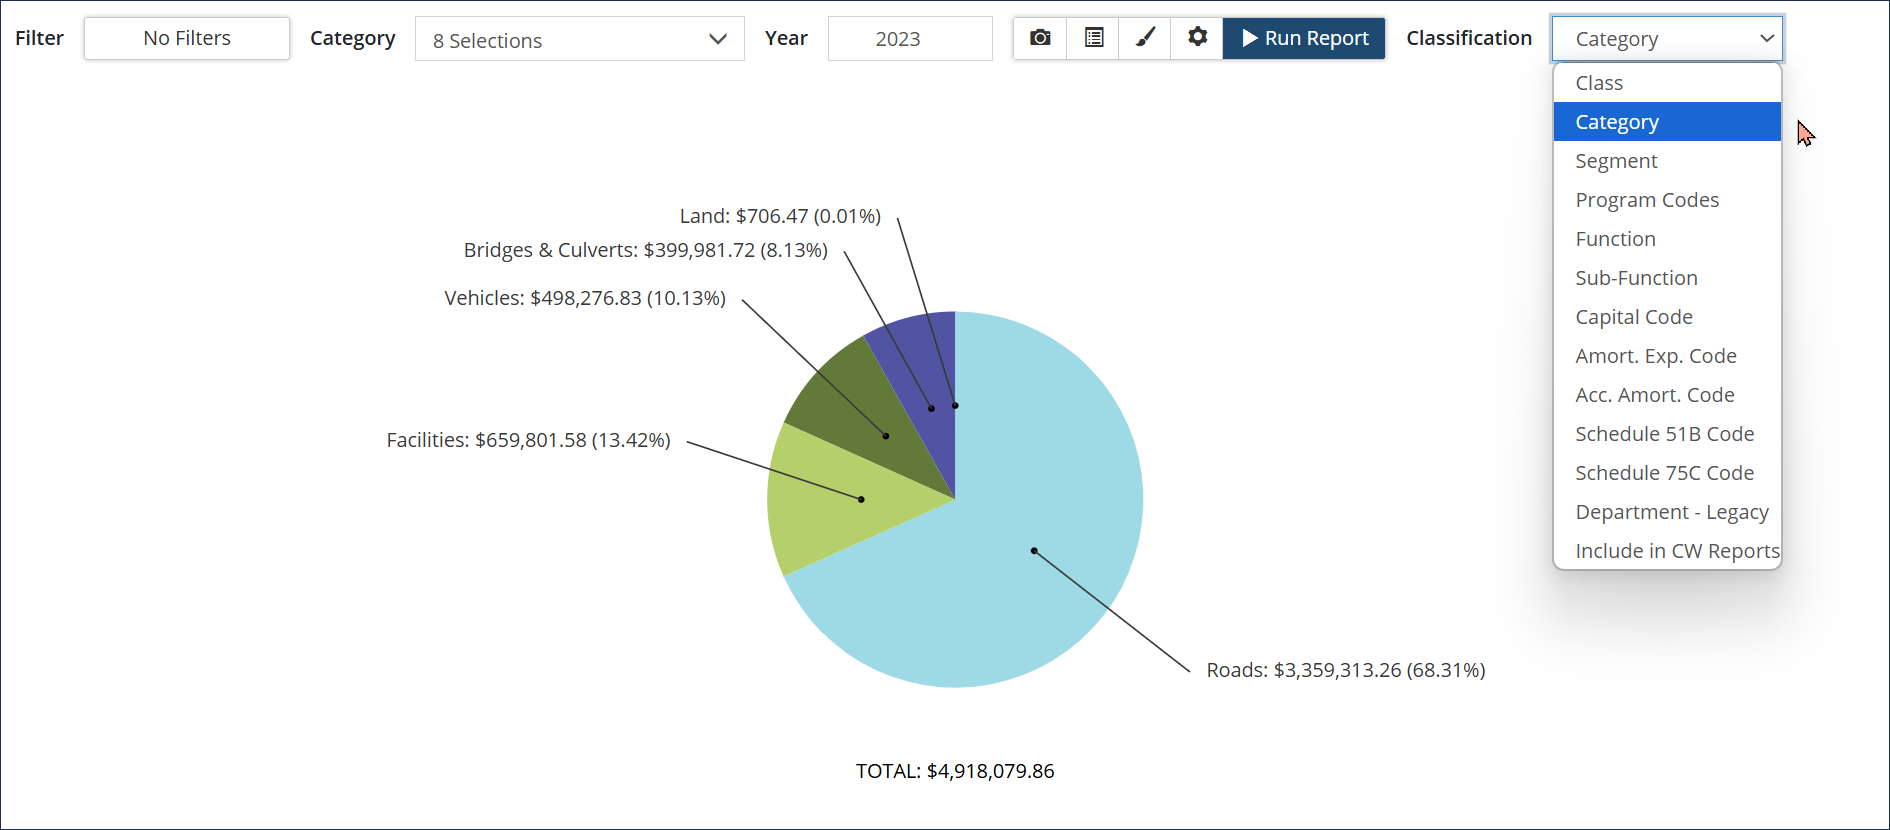
Pie Chart: Visualization of Annual Requirements in relation to the total amount. Labels include both a $ value and a % of the whole. Click Modify Report settings to show/hide Total, hide Empty Values, change Font Size or # of Decimal Places. Click to include/exclude Lifecycle Events, use Adjusted Event Costs, or filter the data to include only Capital, Operating, or Growth events. Click the Classifications dropdown to change the data group chart labels. |
 |
|
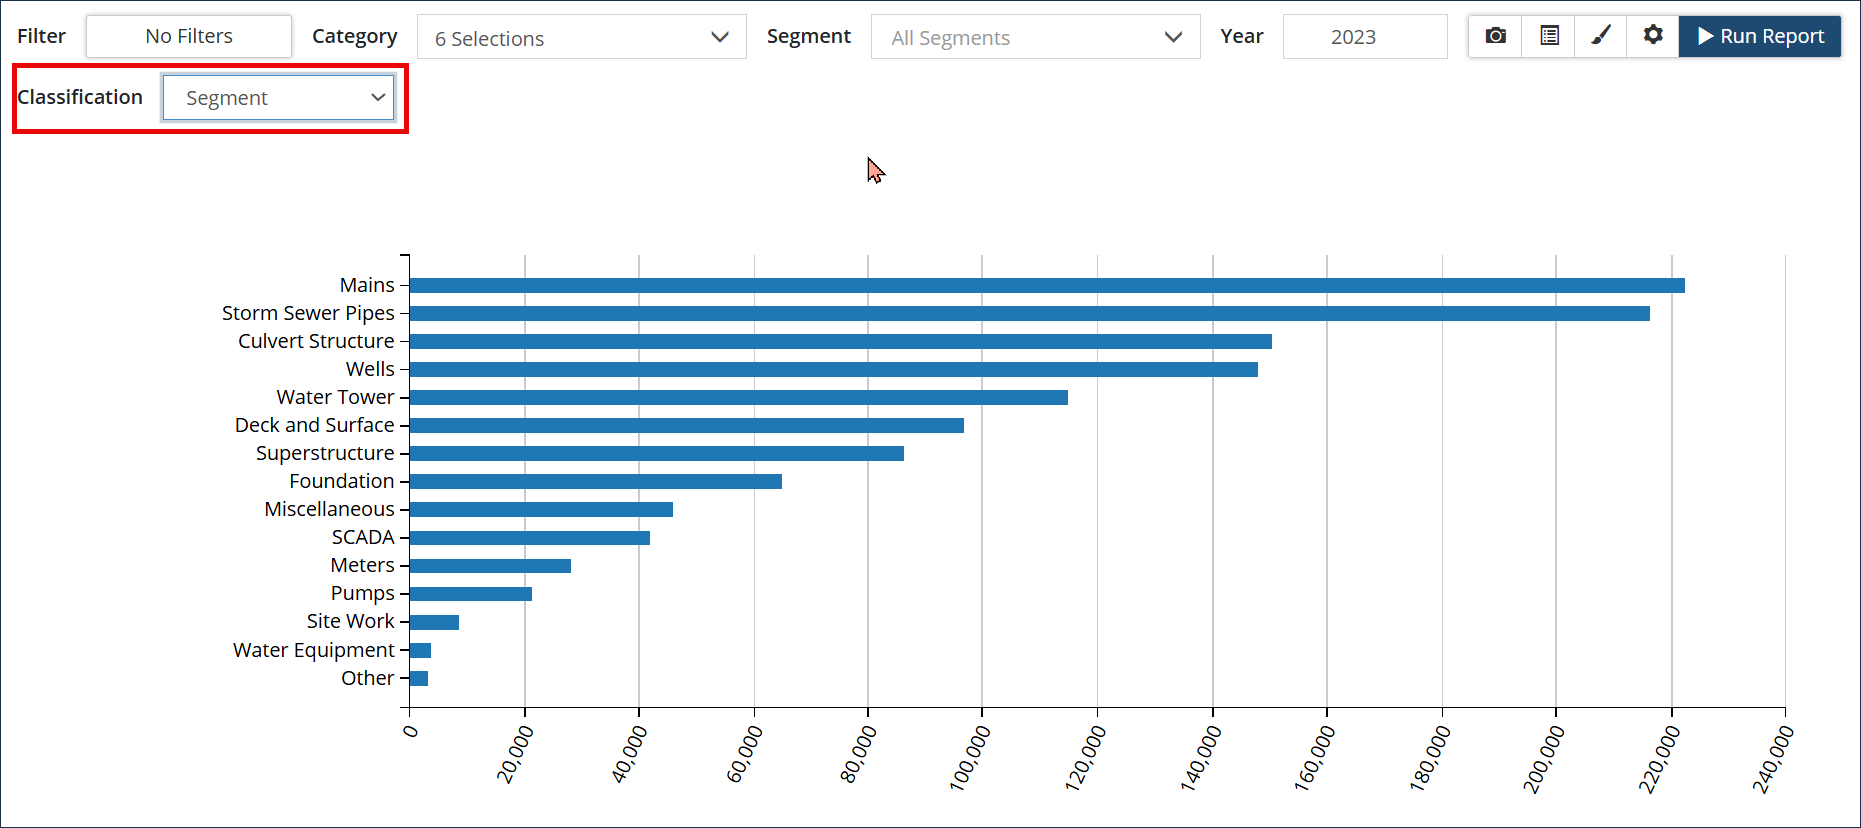
Bar Chart: Visualization of the Annual Requirements in a horizontal bar graph. Hover over an individual data point to display a screen tip with a total annual requirement $ amount. Click to show/hide Total, Sort the x/y-axis in ascending/descending order, change Font Size or # of Decimal Places. Click Modify Report settings to Include Lifecycle Events, use Adjusted Event Costs or filter the data to include only Capital, Operating, or Growth events. Click the Classifications dropdown to change the y-axis labels.
|
 |
Run an Annual Requirement Report
Step 1
Step 2 Grouped by Classification and includes Lifecycle Events*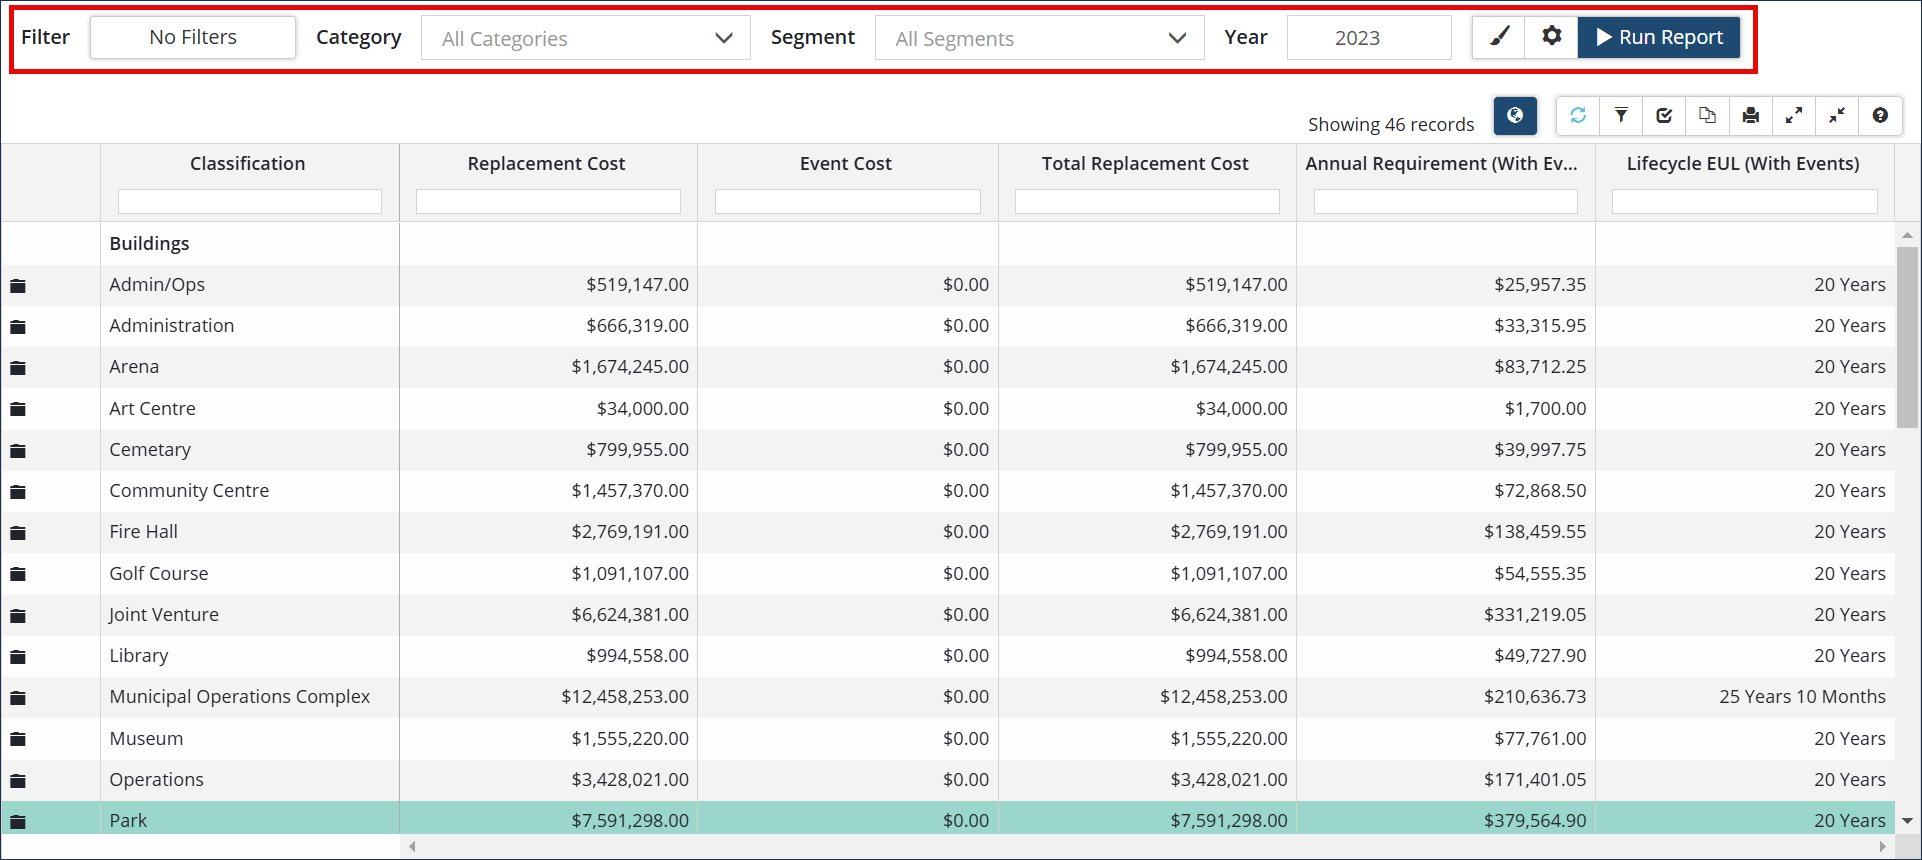
* When Include Lifecycle Events is set to Yes, the report includes the Event Cost and Total Replacement Cost columns.
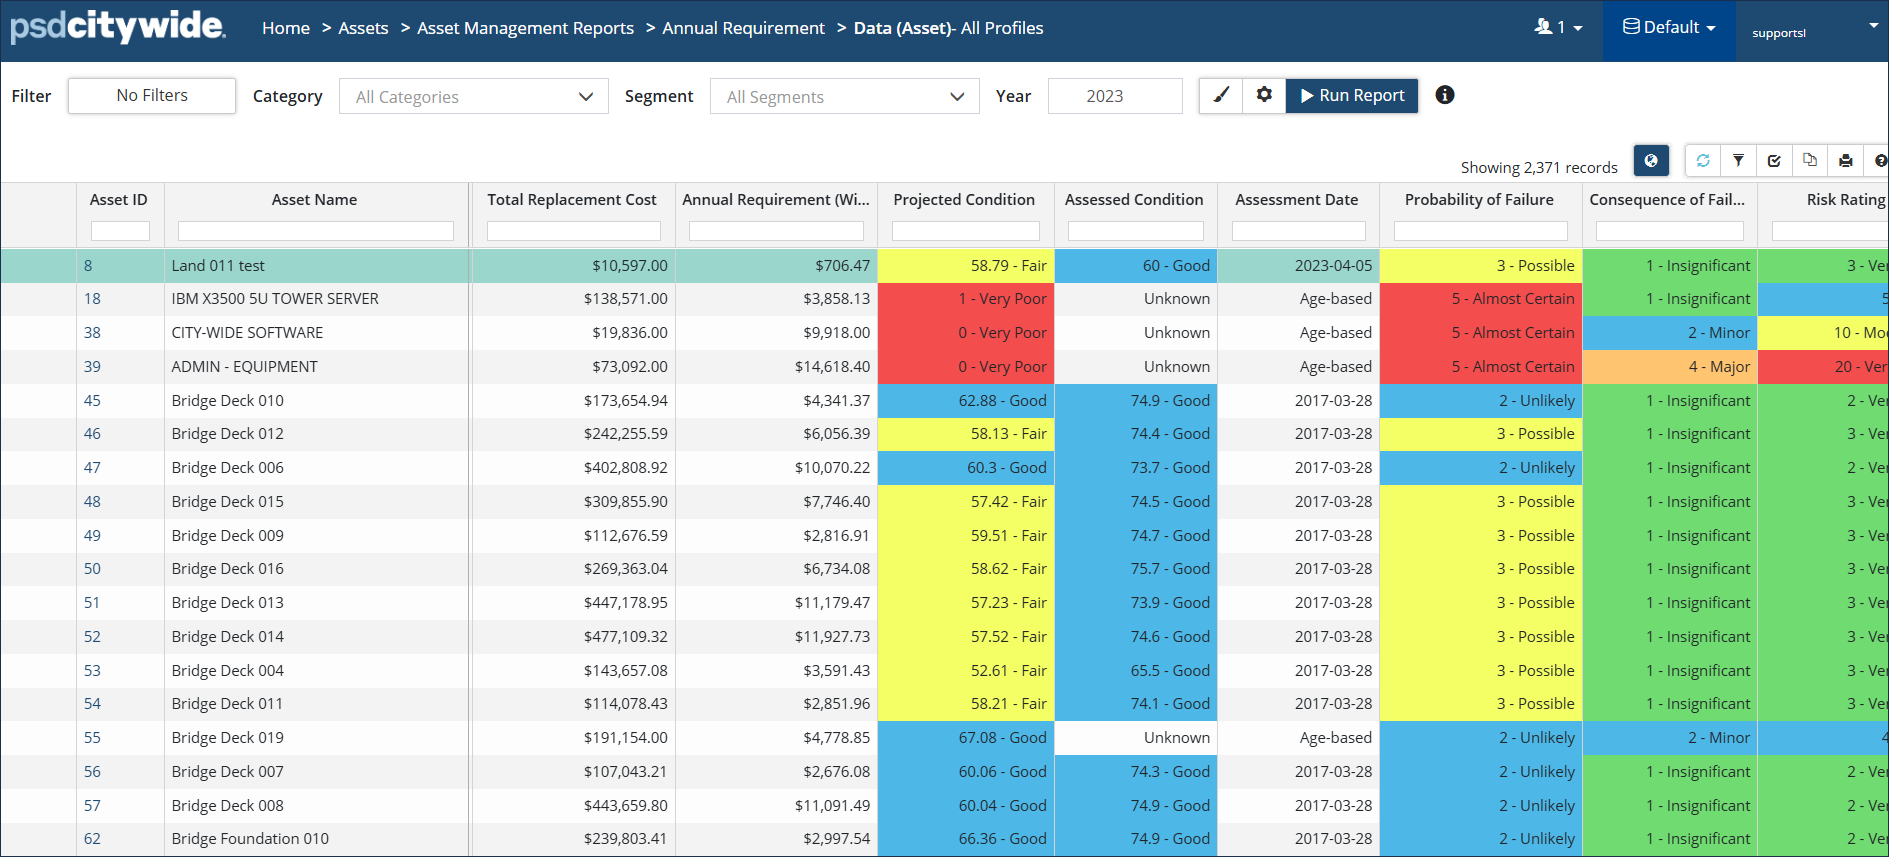
Annual Requirement Report grouped by Assets
Comprehensive report showing the annual requirements, along with condition, risk, and lifecycle information for each individual asset. Rather than grouping the data by Classification or by Profile, this report shows each asset individually without any aggregated totals. This report is best for exporting into Excel if additional calculations, sorting, or filtering outside of Citywide is needed.