Replacement Profile is a multi-year report showing the timing of lifecycle events as well as, the total cost of events in each year. This report can be used as part of a 10-year capital plan project.
|
Report Type |
|
|
Data View (Yearly): Classic multi-year report showing timing and cost of events year after year. Report Selection Criteria settings include: Group By
|
 |
|
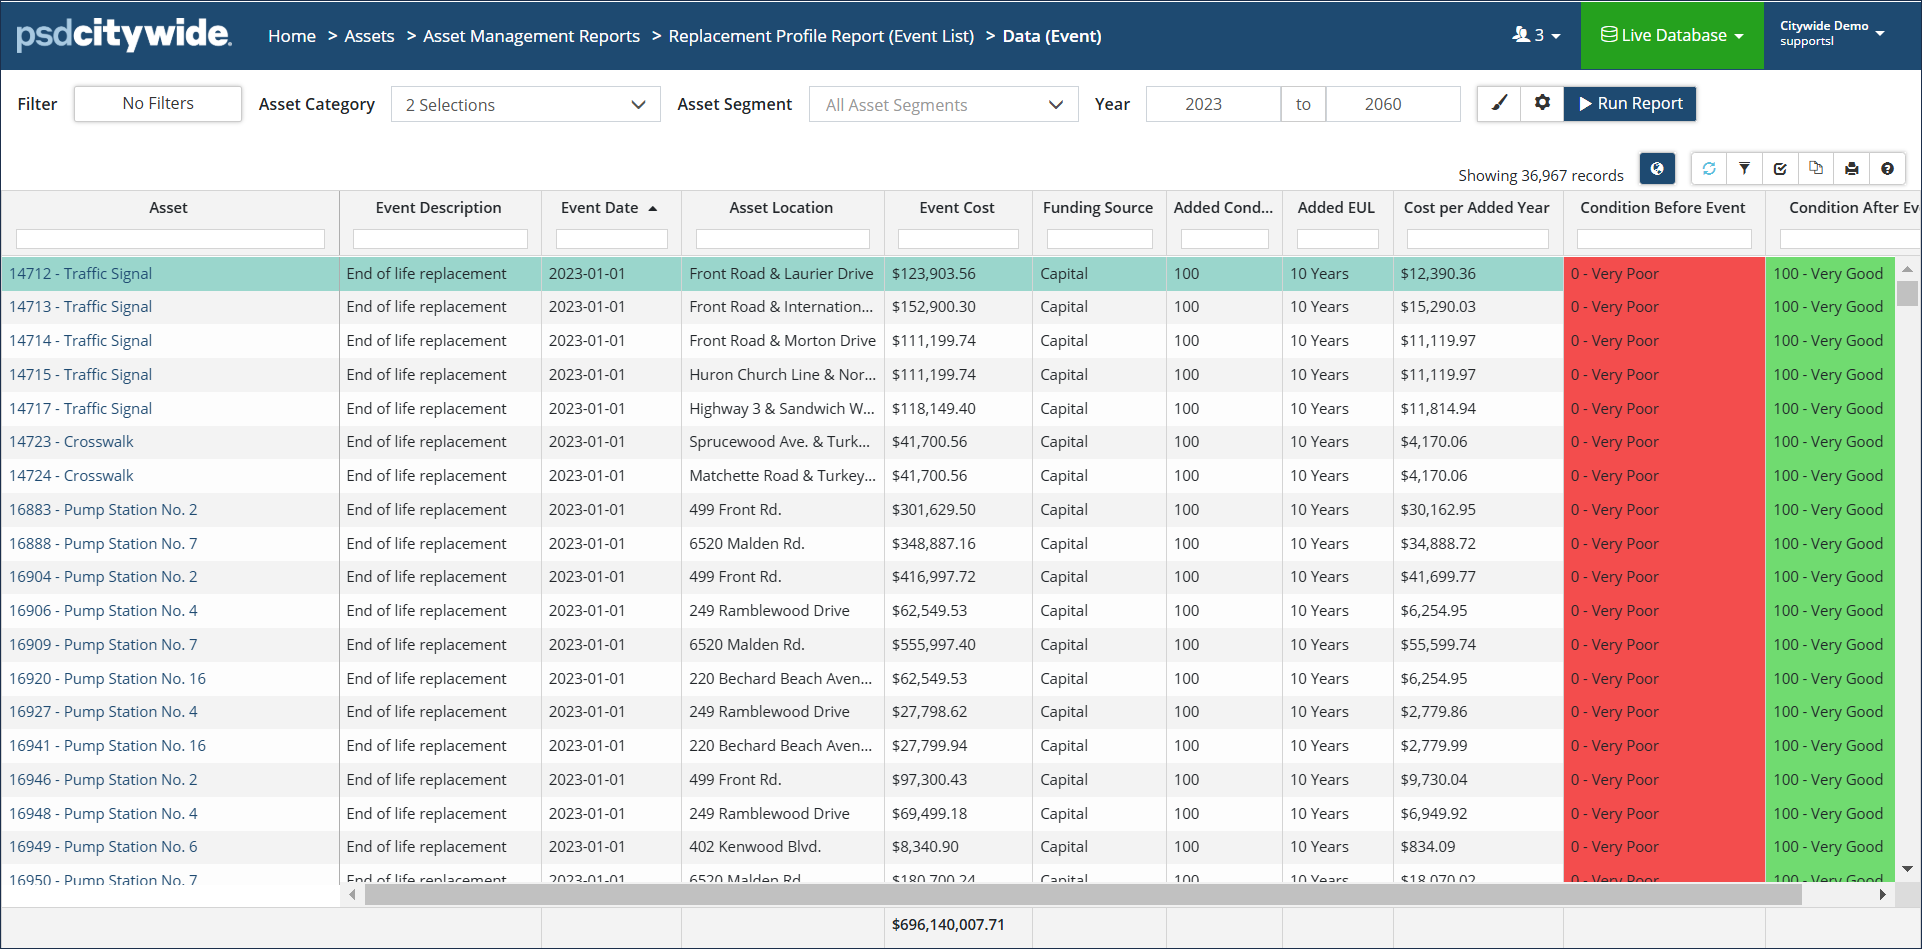
Data View (Event Schedule): Summarizes event cost and date, condition/risk, and shows the impact each lifecycle event will have on the asset. Click display options to change # of decimal place. Click Modify settings icon to change any of the initial parameter selections or to filter the report by a funding source (Capital, Operating, or Growth). Report Selection criteria settings include: ● Same as Data View (Yearly) |
 |
|
Data View (Event List): Shows a detailed summary of lifecycle strategy applied to assets, and the impact, the events will have on asset condition. Click Modify Report settings to change the report options Report selection criteria includes:
|
 |
|
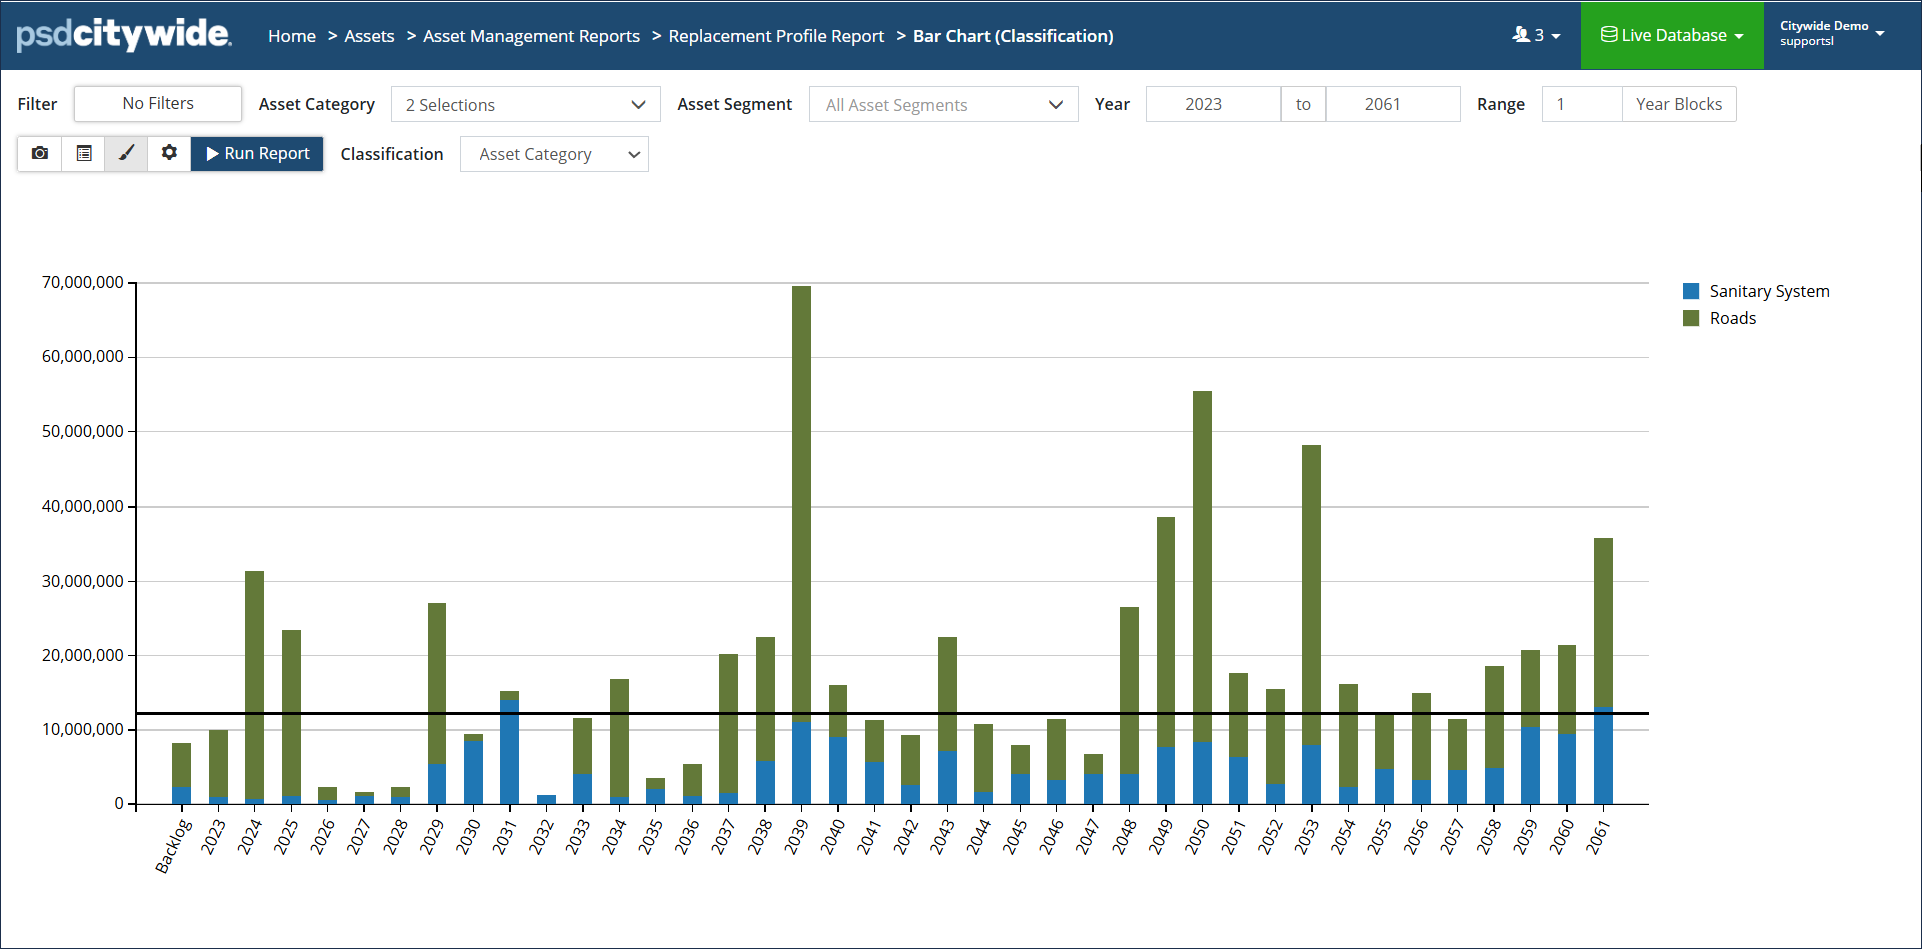
Bar Chart: Data can be grouped by Classification, Profile, or by Lifecycle Event. Click Display options to add an Annual Requirement Trendline. Once checked, Citywide calculates an average annual requirement of the assets using the current strategy. Click to modify report settings and/or to select Adjusted Annual Requirement to have the trendline calculate the average annual requirement with adjustments. |
 |
|
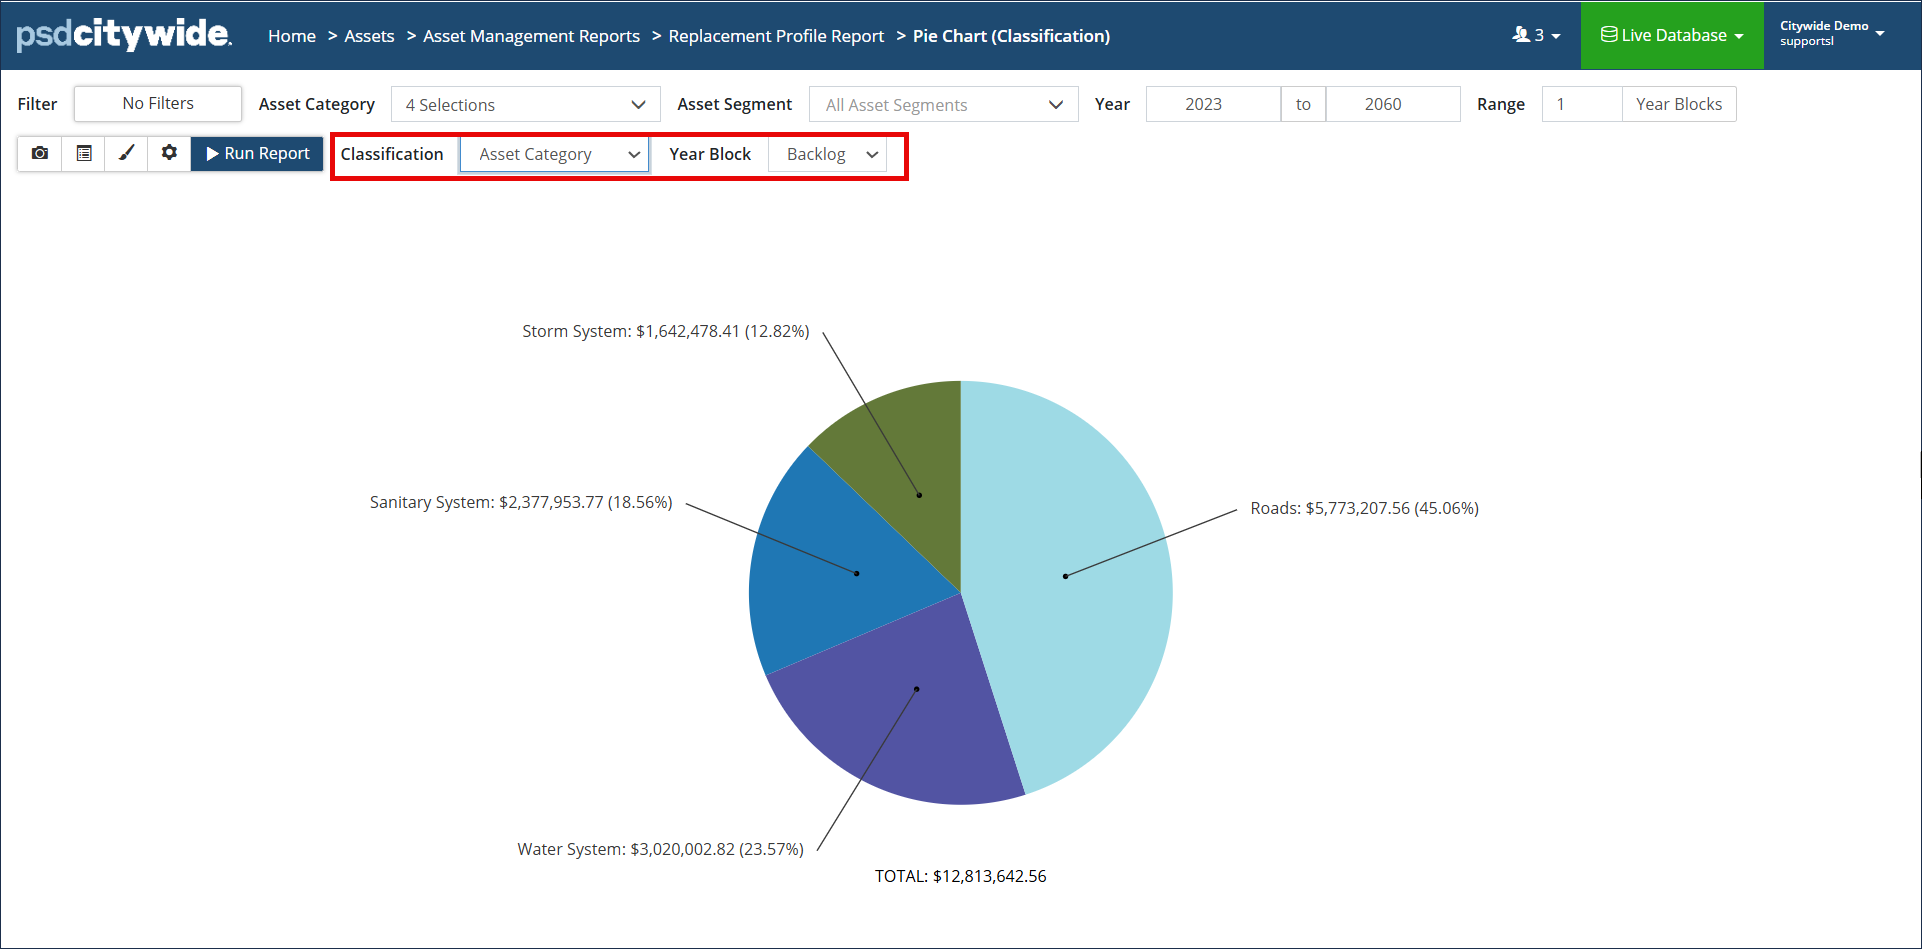
Pie Chart: Shows single-year totals, grouped by Classification, Profile, Block Total, or Lifecycle Events. If grouped by Classification, additional display options become available for the data labels and totals. Click Classification to change the data labels on the pie chart. Click Year Block to view the totals for a different individual year. When grouped by Lifecycle Event only the Year Block field is available. Click to show/hide Total, change Font Size or # of Decimal Places. Click Modify Report settings to Include/exclude Lifecycle Events, use Adjusted Event Costs, or filter the data to include only Capital, Operating, or Growth events. |
 |
|
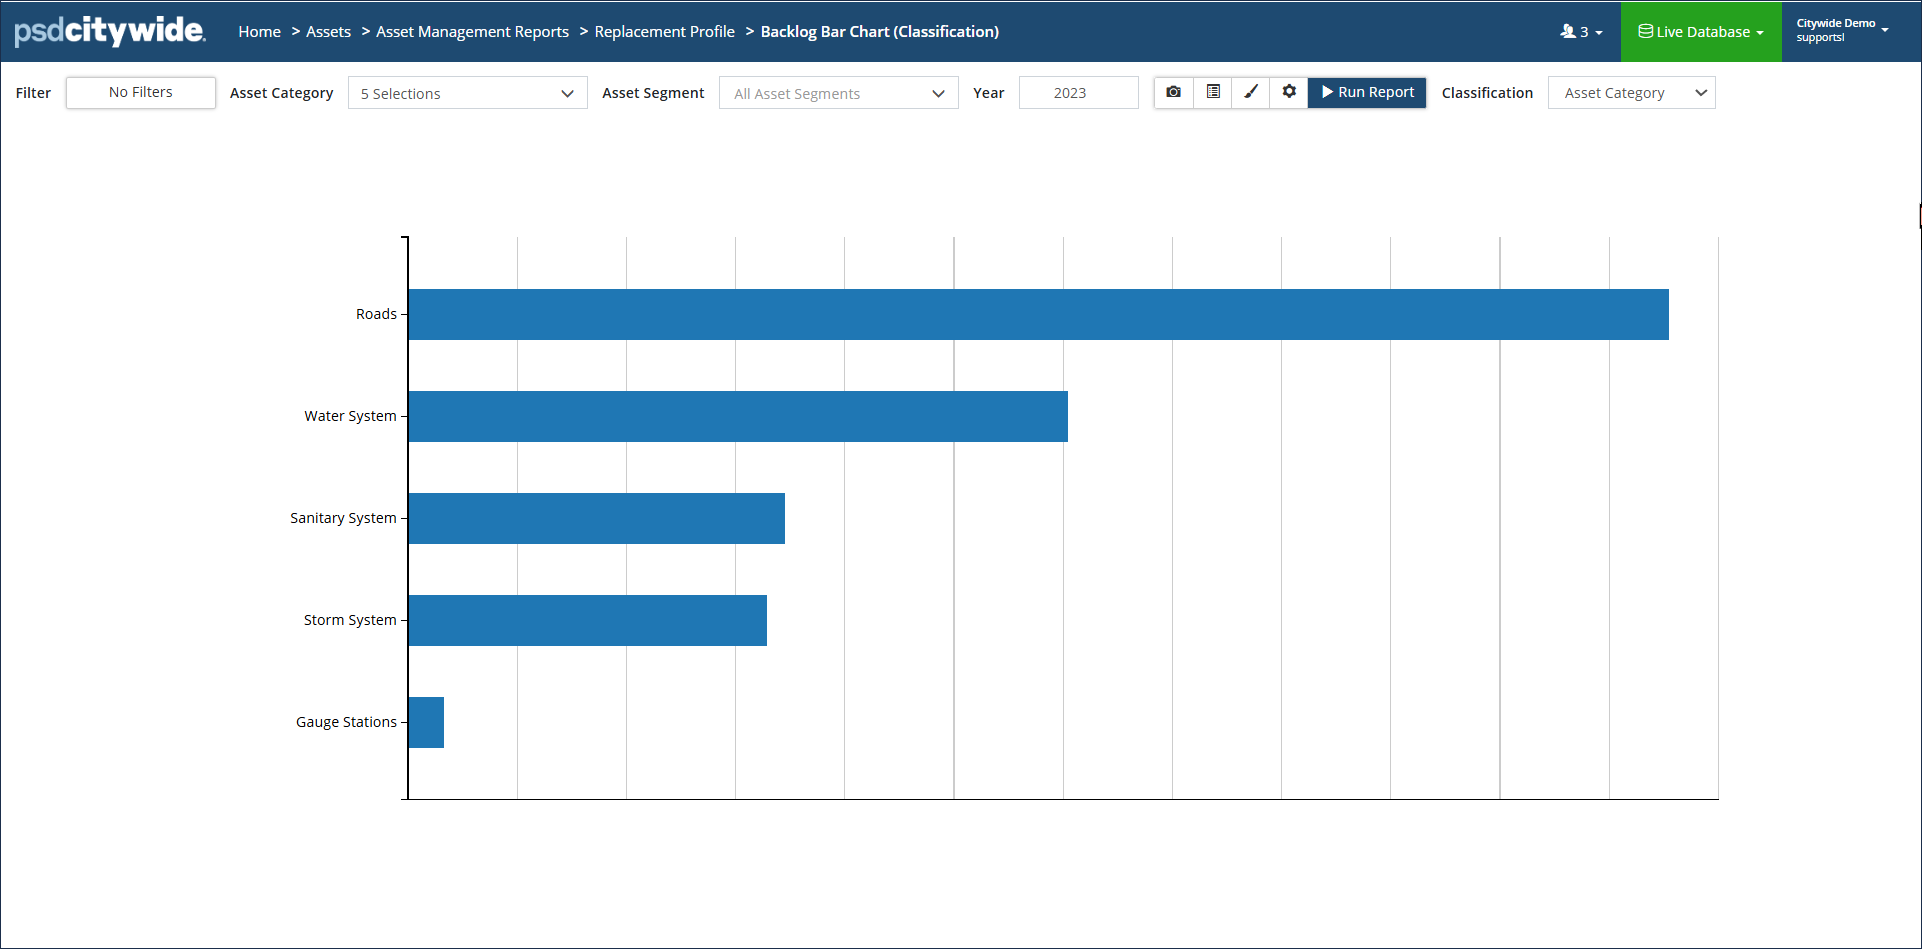
Backlog Bar Chart: Vertical bar chart showing the backlog (assets that are due for replacement. Data can be grouped by Classification or Profile. Click Display options to show a Total or adjust Font Size or # of decimals. Click Modify Report settings to include/exclude Lifecycle Events, filter by Funding Source, or adjust the Strategy Method. |
 |
Run a Replacement Profile Report (Data View: Yearly)
Step 1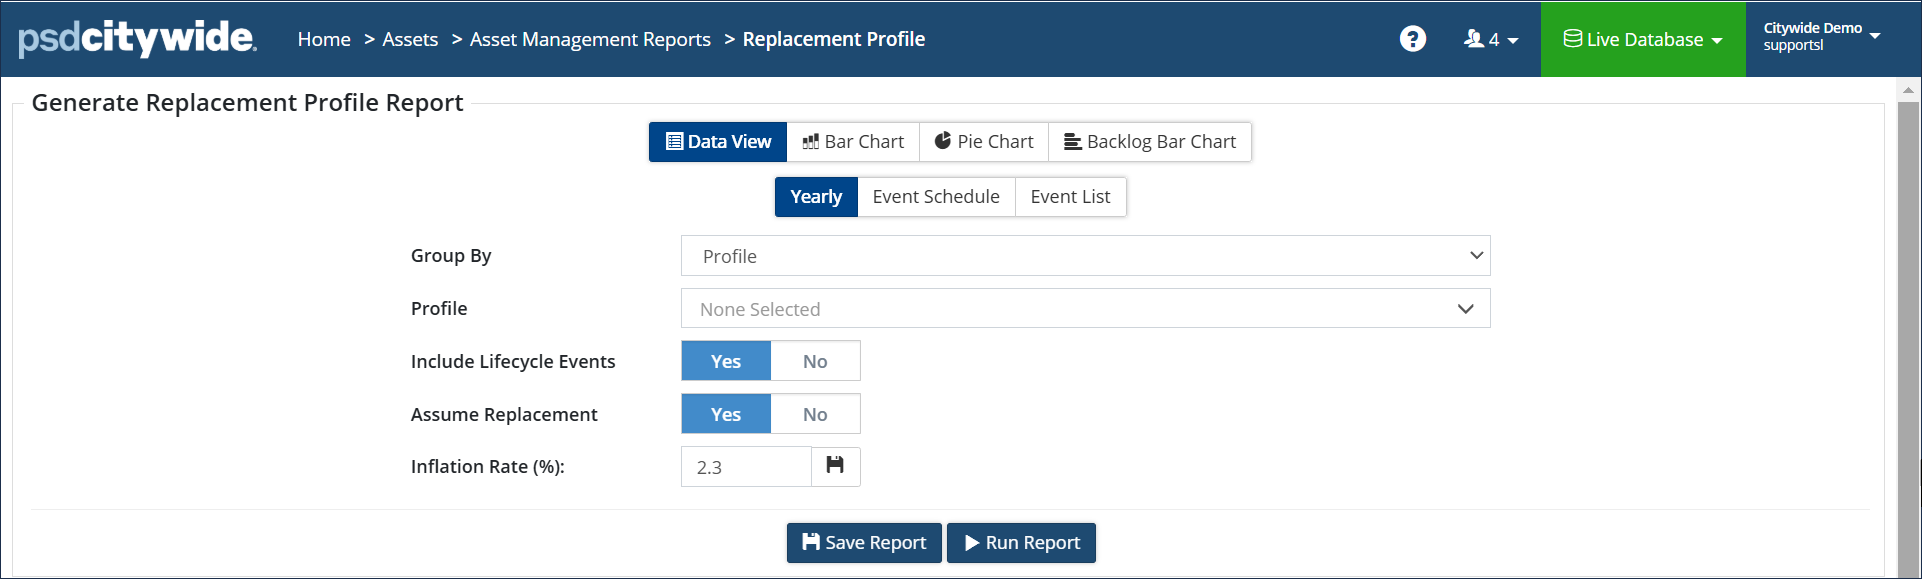
Include Lifecycle Events defaults to Yes. The report output will include all Lifecycle events as defined in the asset profiles and can include costing information and funding source (Capital, Operating, or Growth). To report only on replacement events, set the flag to No.
Assume Replacement flag, when set to Yes, will assume a new iteration of the asset and apply the lifecycle strategy again until the end of the reporting timeframe.
Inflation Rate (%) applies an inflation rate to event costs year after year. Click ![]() to save the inflation rate as a default for future iterations of this report.
to save the inflation rate as a default for future iterations of this report.
Step 2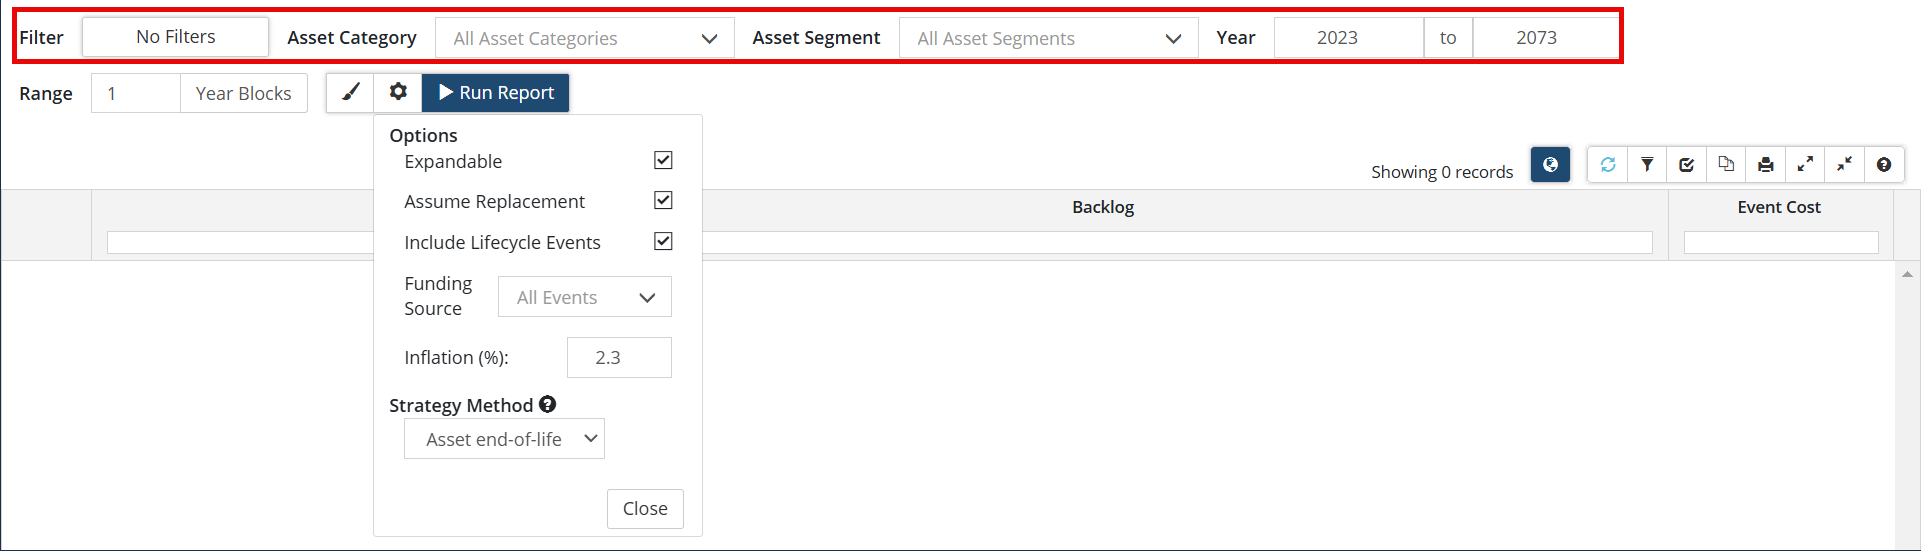
Click No Filters to narrow the scope of the assets collected in the report to a specific Coordinated ID or Classification. For example, in step 1 the Roads profile was selected and this will pull only the assets grouped under the Roads profile into the report. You can then further filter the assets by a Co-ordinated ID or a Classification, such as a Capital Code or Department.
Enter a year Range and Year Blocks.
Click ![]() to review report settings. You can:
to review report settings. You can:
- Filter the output by a Funding Source (Capital, Operating, or Growth)
- Change the Strategy Method which defaults to Asset end-of-life meaning the asset’s first replacement is based on its original financial EUL (modified by adjustments and condition assessments). Select Lifecycle EUL to base the asset’s first replacement on its lifecycle EUL, ignoring financial adjustments and condition assessments (mouse over the blue bubble for a full description). Click Run Report.
Report 1: Include Lifecycle events flag is set to Yes; all funding sources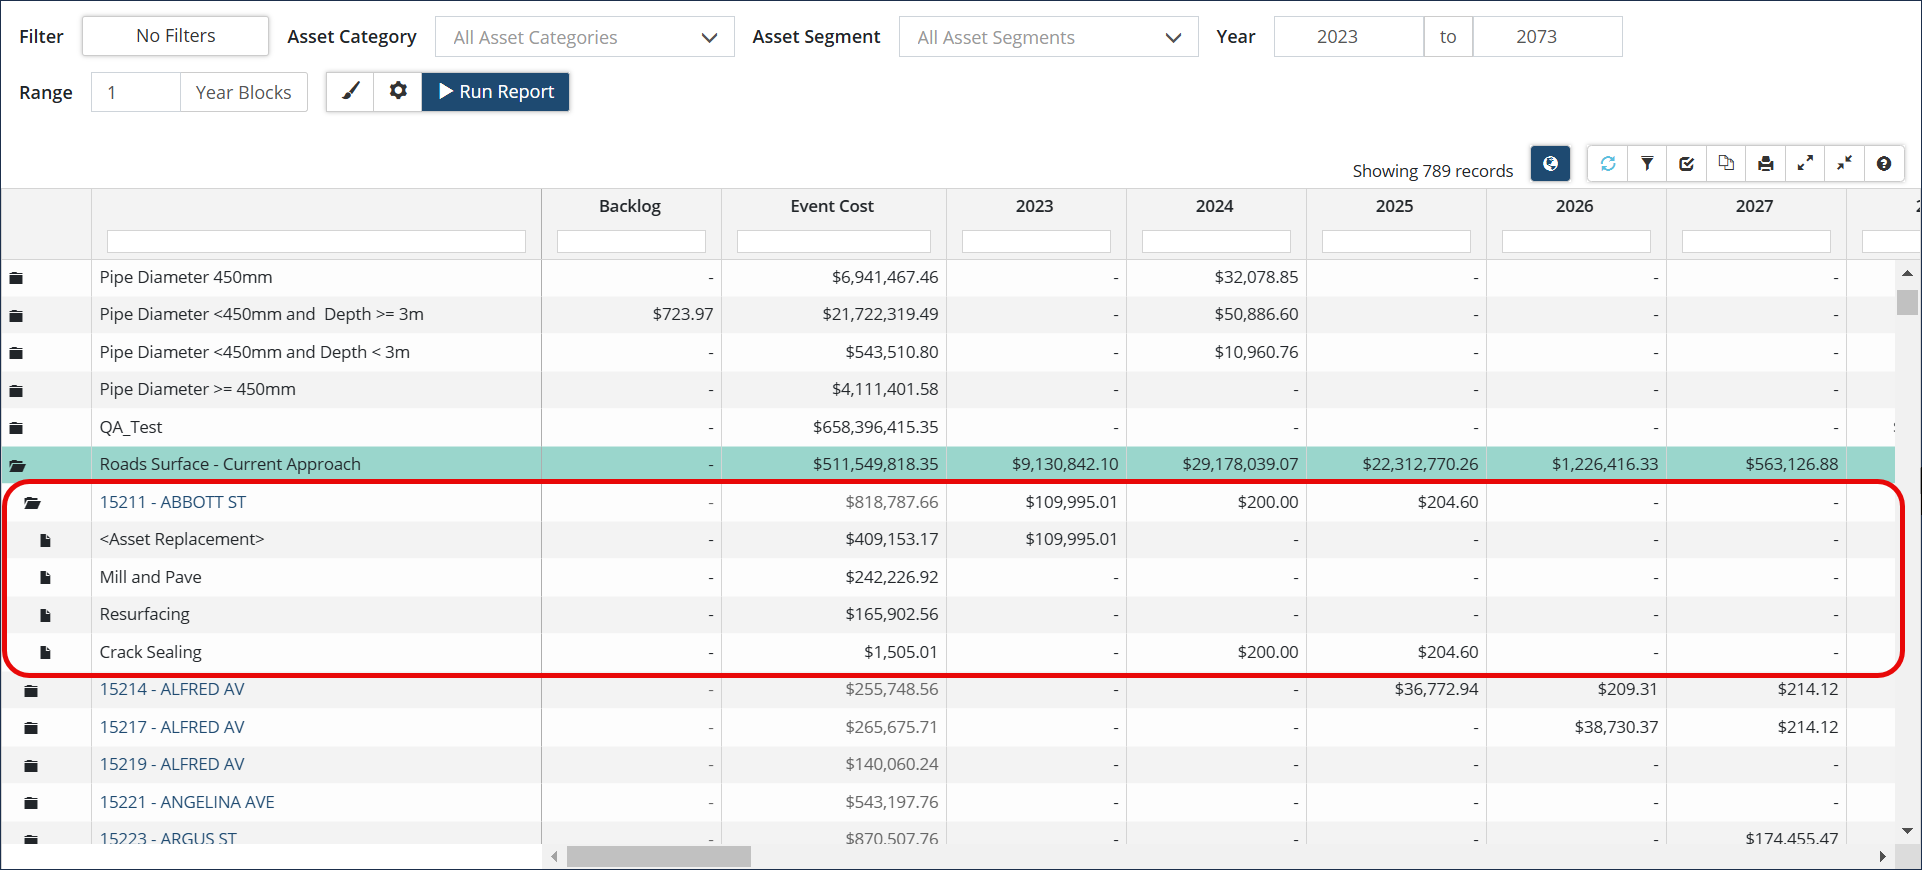
Report 2: Include Lifecycle Events flag is set to No; only Replacement events are included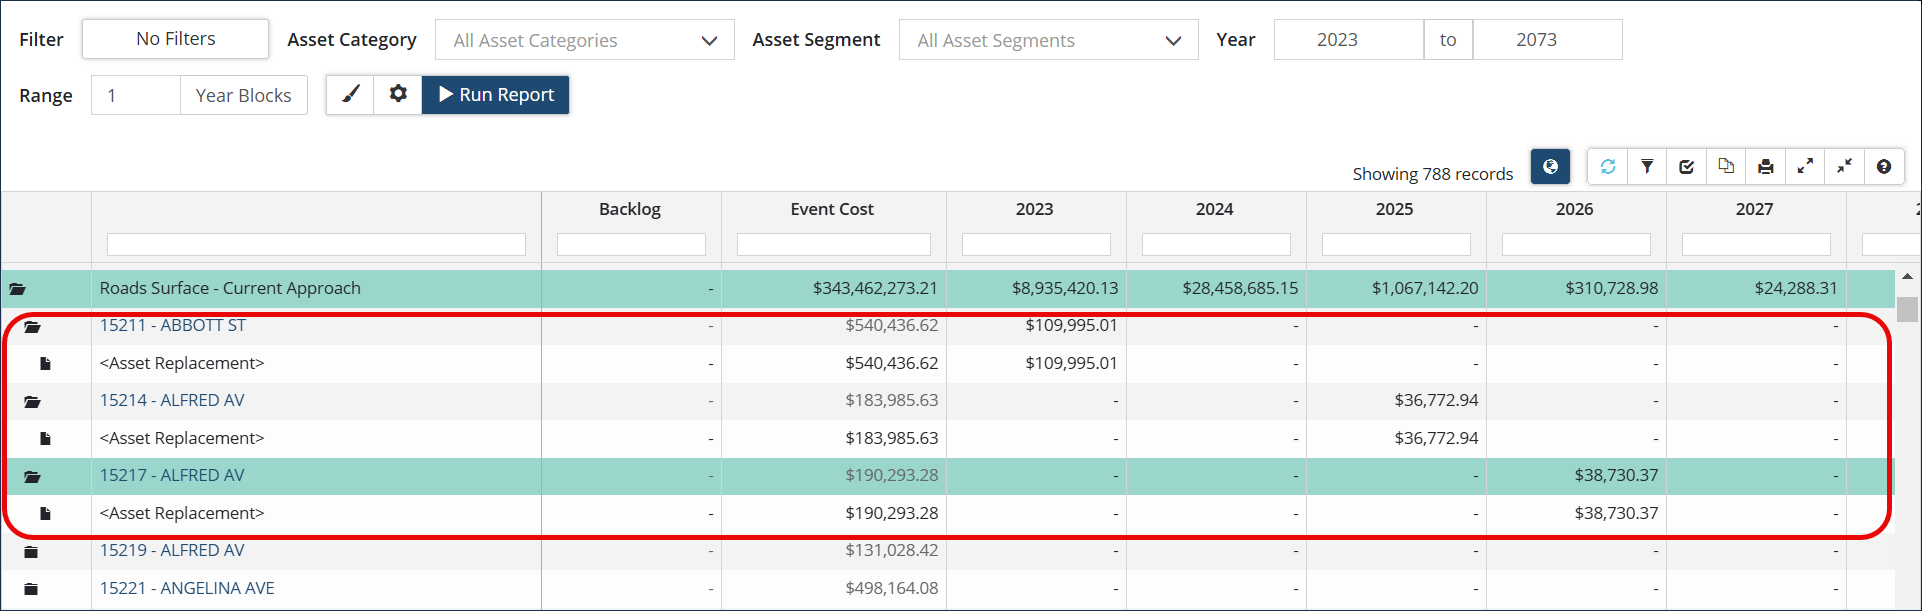
Once the report is generated, click ![]() to the left of a grouping to expand it which allows you to view asset level detail, or click
to the left of a grouping to expand it which allows you to view asset level detail, or click ![]() in the upper right toolbar to Expand All.
in the upper right toolbar to Expand All.
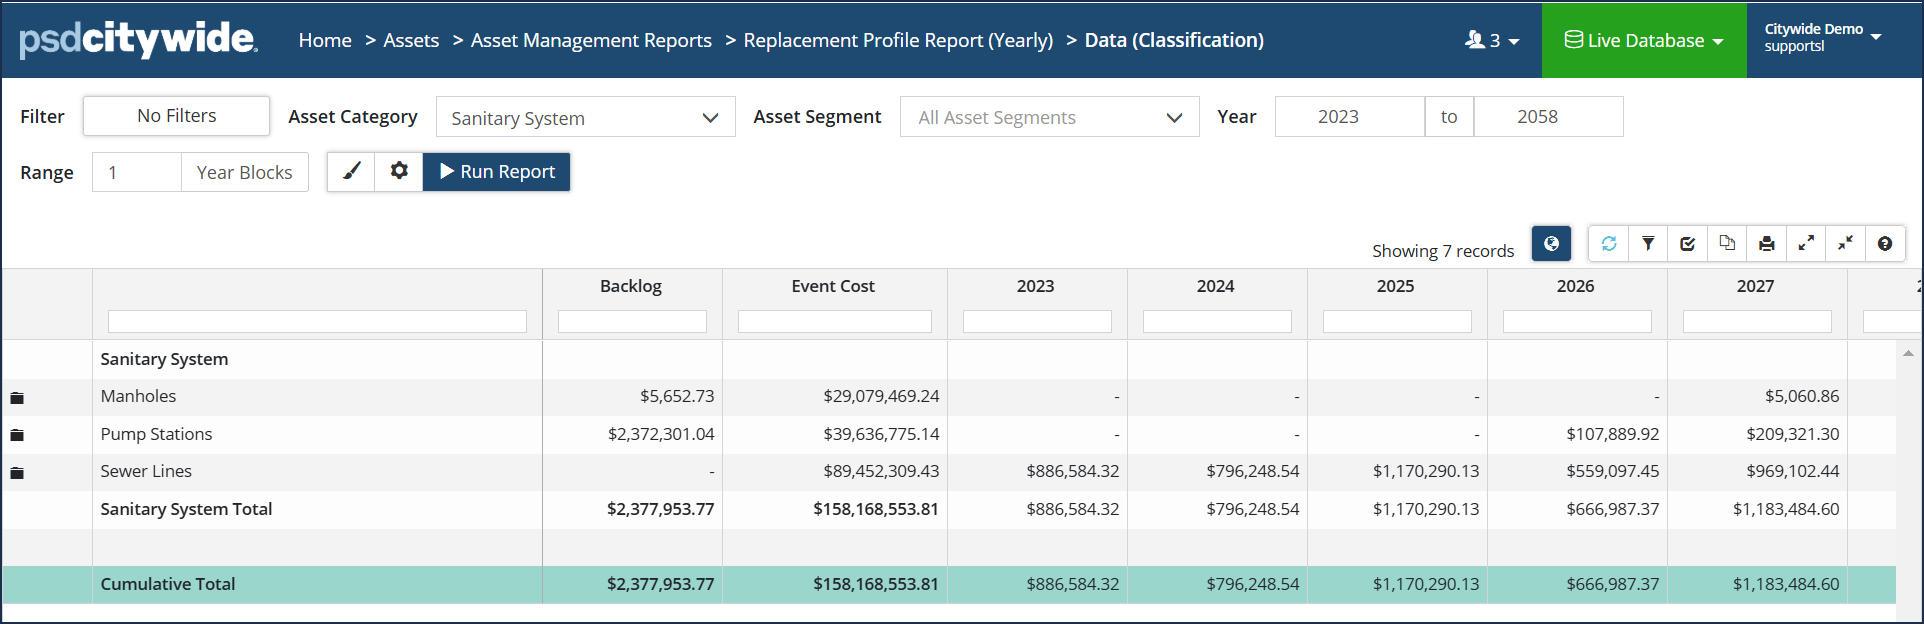
The Backlog column refers to assets that have reached the end of their EUL and need replacement. The Strategy Method by default, is set to Asset end-of-life, so the timing for the asset’s first replacement is based on its original financial EUL, modified by adjustments and condition assessments. Therefore, backlogged assets have surpassed their original financial EUL, and either do not have any condition assessments/financial adjustments to the EUL, or have a condition assessment/financial adjustment, but the new projected replacement date/adjusted EUL has also been surpassed. For future replacements or lifecycle iterations, the, Lifecycle EUL and strategy is used. Click the Modify Report button to see and change the strategy method in use for the report.
The Event Cost column summarizes the total cost of all events in all years of the reporting timeframe, including the backlog. The year columns show the cost for events that are scheduled for each year. To shift events or view an asset’s lifecycle strategy, click the Asset ID field to open the asset view, then click Strategy in the navigation pane on the left.
Run a Replacement Profile Bar Chart
Step 1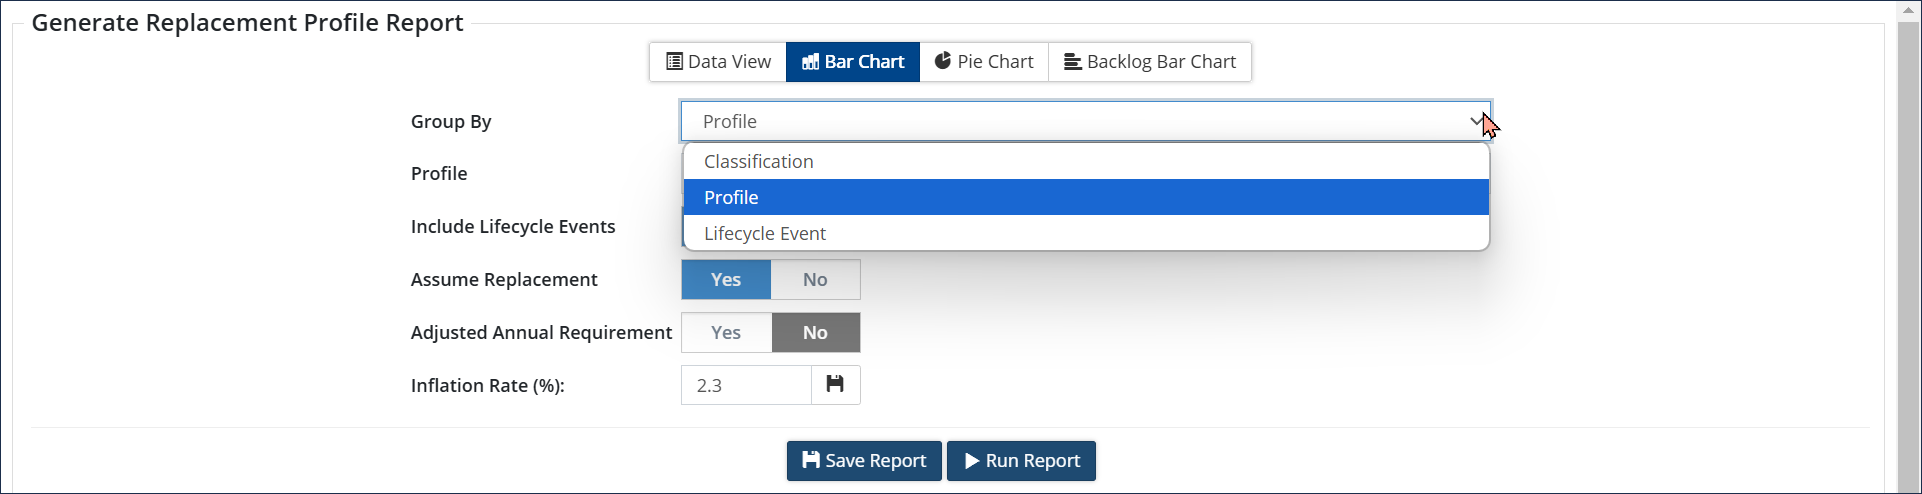
Group By includes Classification, Profile and Lifecycle Events. If grouping by Lifecycle Events, you can filter the report to show assets by Category(s) and Segment(s) on the next screen. When the report generates, data will be aggregated by the lifecycle events found in the profile(s) of the selected assets.
Include Lifecycle Events defaults to Yes. The report output will include all Lifecycle events as defined in the asset profiles and will include costing information and funding source (Capital, Operating, or Growth). To report only on replacement events set the flag to No.
Assume Replacement defaults to Yes. Citywide will assume a new iteration of the asset and apply the lifecycle strategy again until the end of the reporting timeframe.
Adjusted Annual Requirement defaults to No and is used with the Annual Requirement Trendline. An annual requirement is the average investment amount needed for future infrastructure replacement and events, and is calculated as Replacement cost divided by EUL or (Lifecycle EUL). The Annual Requirement is shown at the asset level on the Profile screen. There are three annual requirements: without events, with events, and with events, adjusted. (If Include Lifecycle Events is set to No, the Adjusted Annual Requirement flag is hidden.)
Asset View: Profile screen
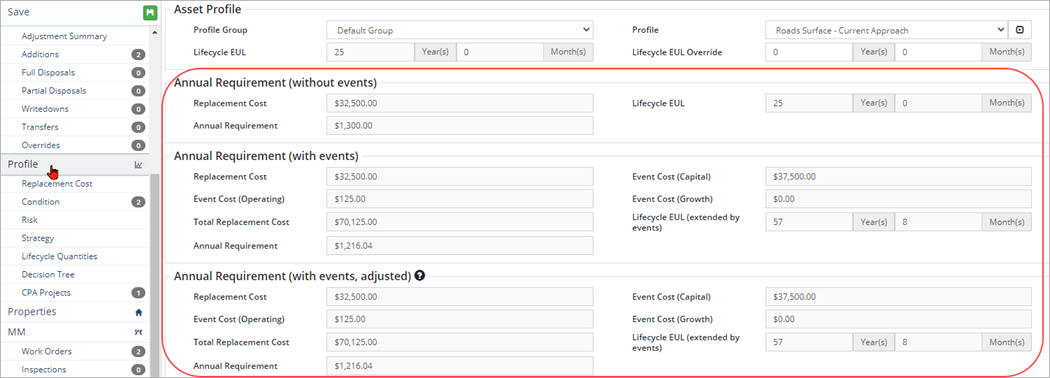
The Annual Requirement (with events, adjusted) option will substitute event costs with costs from scheduled lifecycle events when applicable. Non-strategy and skipped events will not have an impact on the requirement’s EUL or Lifecycle EUL divisor.
Inflation Rate (%) applies an inflation rate to event costs year after year. Click to save the inflation rate as the default.
Step 2: Data is grouped by Lifecycle Events, filtered to Roads (Category)/Surface (Segment) assets, and includes an Annual Requirement Trendline
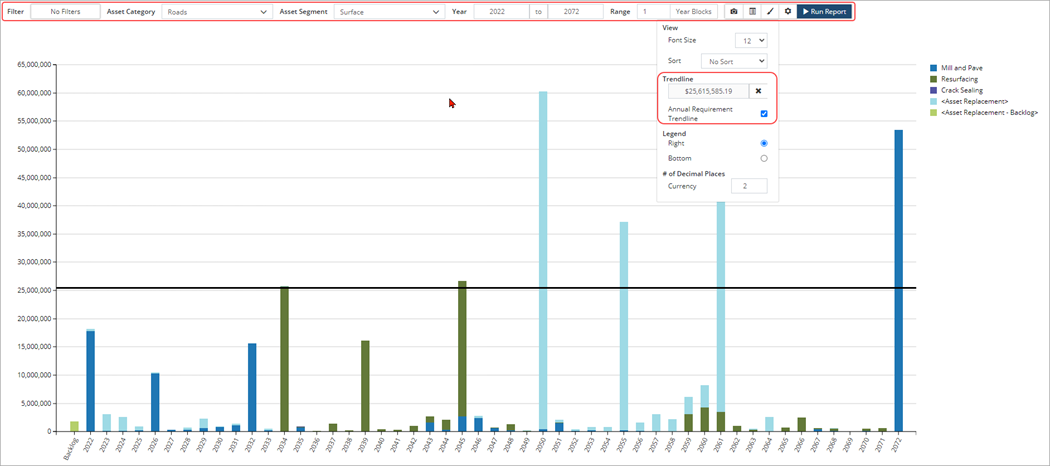
Select assets form the Category and Segment drop down list. Click No Filters to further narrow the scope of the assets collected in the report to a specific Coordinated ID or Classification. Enter a year Range and Year Blocks.
Click ![]() to change display options and to add an Annual Requirement Trendline. Once Annual Requirement Trendline is checked, Citywide uses the information found on the Profile screen at the asset level to calculate the annual requirement trendline. The annual requirement $ amount is shown in the trendline field. By default, this will pull the annual requirement with events, however the report settings can be changed on the previous screen to one of the three calculation options:
to change display options and to add an Annual Requirement Trendline. Once Annual Requirement Trendline is checked, Citywide uses the information found on the Profile screen at the asset level to calculate the annual requirement trendline. The annual requirement $ amount is shown in the trendline field. By default, this will pull the annual requirement with events, however the report settings can be changed on the previous screen to one of the three calculation options:
|
|
Include Lifecycle Events flag |
Adjusted Annual Requirement flag |
|
Annual Requirement (without events) |
No |
N/A |
|
Annual Requirement (with events) |
Yes |
No |
|
Annual Requirement (with events, adjusted) |
Yes |
Yes |
Click ![]() to review and modify report settings. You can filter the output by a Funding Source (Capital, Operating, or Growth) as well as change the Strategy Method which defaults to Asset end-of-life meaning the asset’s first replacement is based on its original EUL (modified by adjustments and condition assessments). Select Lifecycle EUL to base the asset’s first replacement on its lifecycle EUL (mouse over the blue bubble for a full description). Click Run Report.
to review and modify report settings. You can filter the output by a Funding Source (Capital, Operating, or Growth) as well as change the Strategy Method which defaults to Asset end-of-life meaning the asset’s first replacement is based on its original EUL (modified by adjustments and condition assessments). Select Lifecycle EUL to base the asset’s first replacement on its lifecycle EUL (mouse over the blue bubble for a full description). Click Run Report.
Replacement Profile Reports Filtered by Funding source
Capital Replacement Profile - Replacement Profile report filtered for Capital events only, excluding operating and growth events.
Operating Replacement Profile - Replacement Profile report filtered for Operating events, only, excluding capital and growth events.
Growth Replacement Profile - Replacement Profile report filtered for Growth events, only, excluding capital and operating events.