This report allows for analysis of data based on Attribute information. The output shows attribute data (i.e., the values found in the selected attribute field), an asset count, a total adjusted quantity, as well as a total replacement cost. The report works best when assets can be grouped together based on the input data of a single attribute.
Step 1
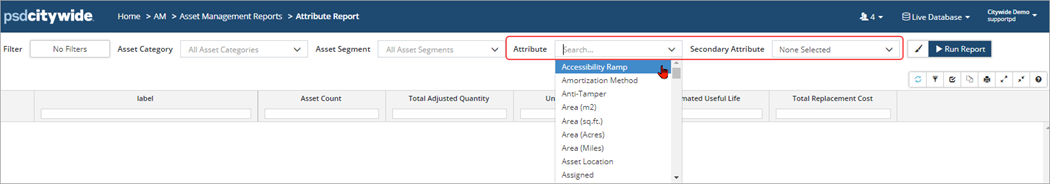
Attribute: Select the attribute you would like to report on by scrolling through the list or using the search field at the top of the dropdown. The report will summarize all assets that have the same information on the selected attribute.
Secondary Attribute: Add a secondary attribute (optional), if you would like an additional summary column displaying the value (or total if the attribute is a number or currency type) for each asset in the report.
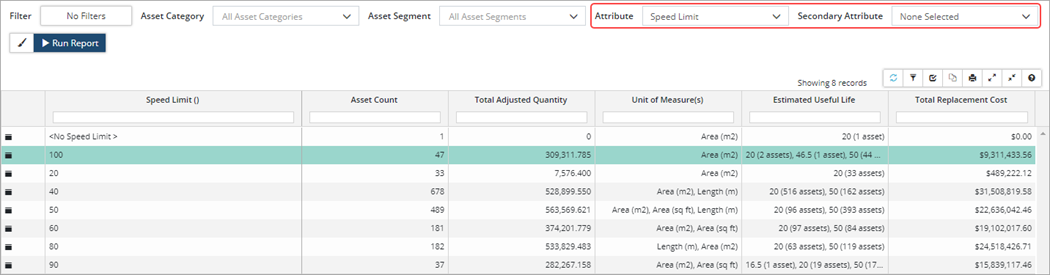
Report 1: Summary of Speed Limit attribute data; assets are grouped by speed limit input values found on the attribute
Report 2: Summary of Speed Limit attribute data and includes a secondary attribute (Average Annual Daily Traffic); assets are grouped by speed limit values
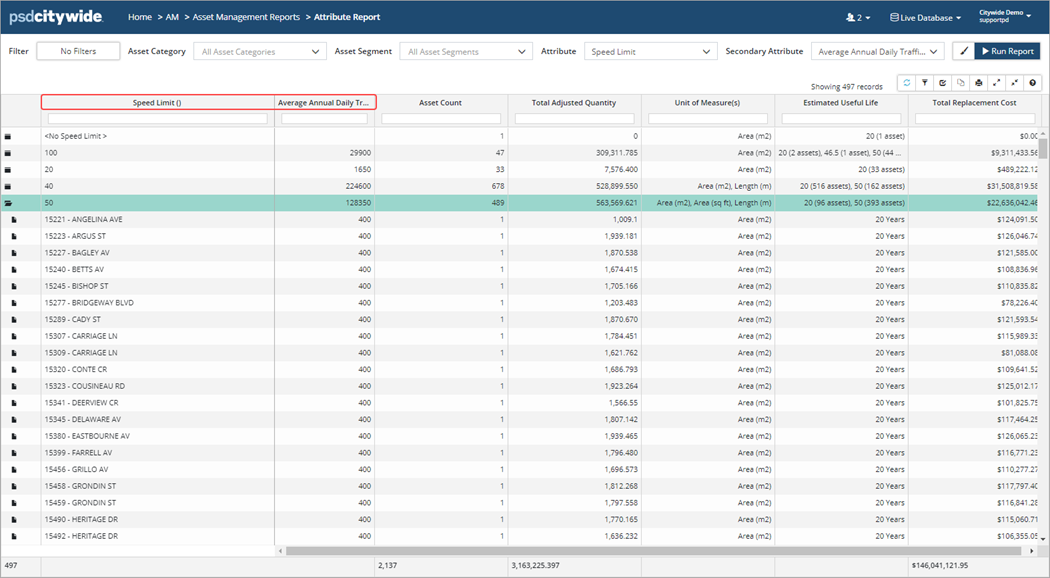
In the screenshot above, the secondary attribute, asset counts, quantities, EULs, and replacement costs are summarized for each Speed Limit entry. For example, for all 489 assets with a Speed Limit of 50, the total Average Annual Daily Traffic is 128,350.
This report works especially well for dropdown-type Attributes, or any attribute that has a limited number of entries. For example, a Surface Type attribute with a dropdown list of options that include Gravel, HCB, HL1, LCB. Assets can be grouped by the individual surface type. This report would not work well for attributes that can be unique on every single asset, like a unique ID, an unlimited cost/number, or a note/description.