Reports on the Projected Condition of assets for the reporting year, using the most recent condition assessment and can include Lifecycle events if running the report for future years. The condition is projected to the end of the reporting year based on the asset’s EUL and condition assessments, if any exist.
When Lifecycle events are included, the projected condition reflects condition assessment information and any lifecycle strategy events that impact the asset’s condition for the reporting year (i.e., a road asset whose condition is improved after a mill and pave event).
|
Report Type |
|
|
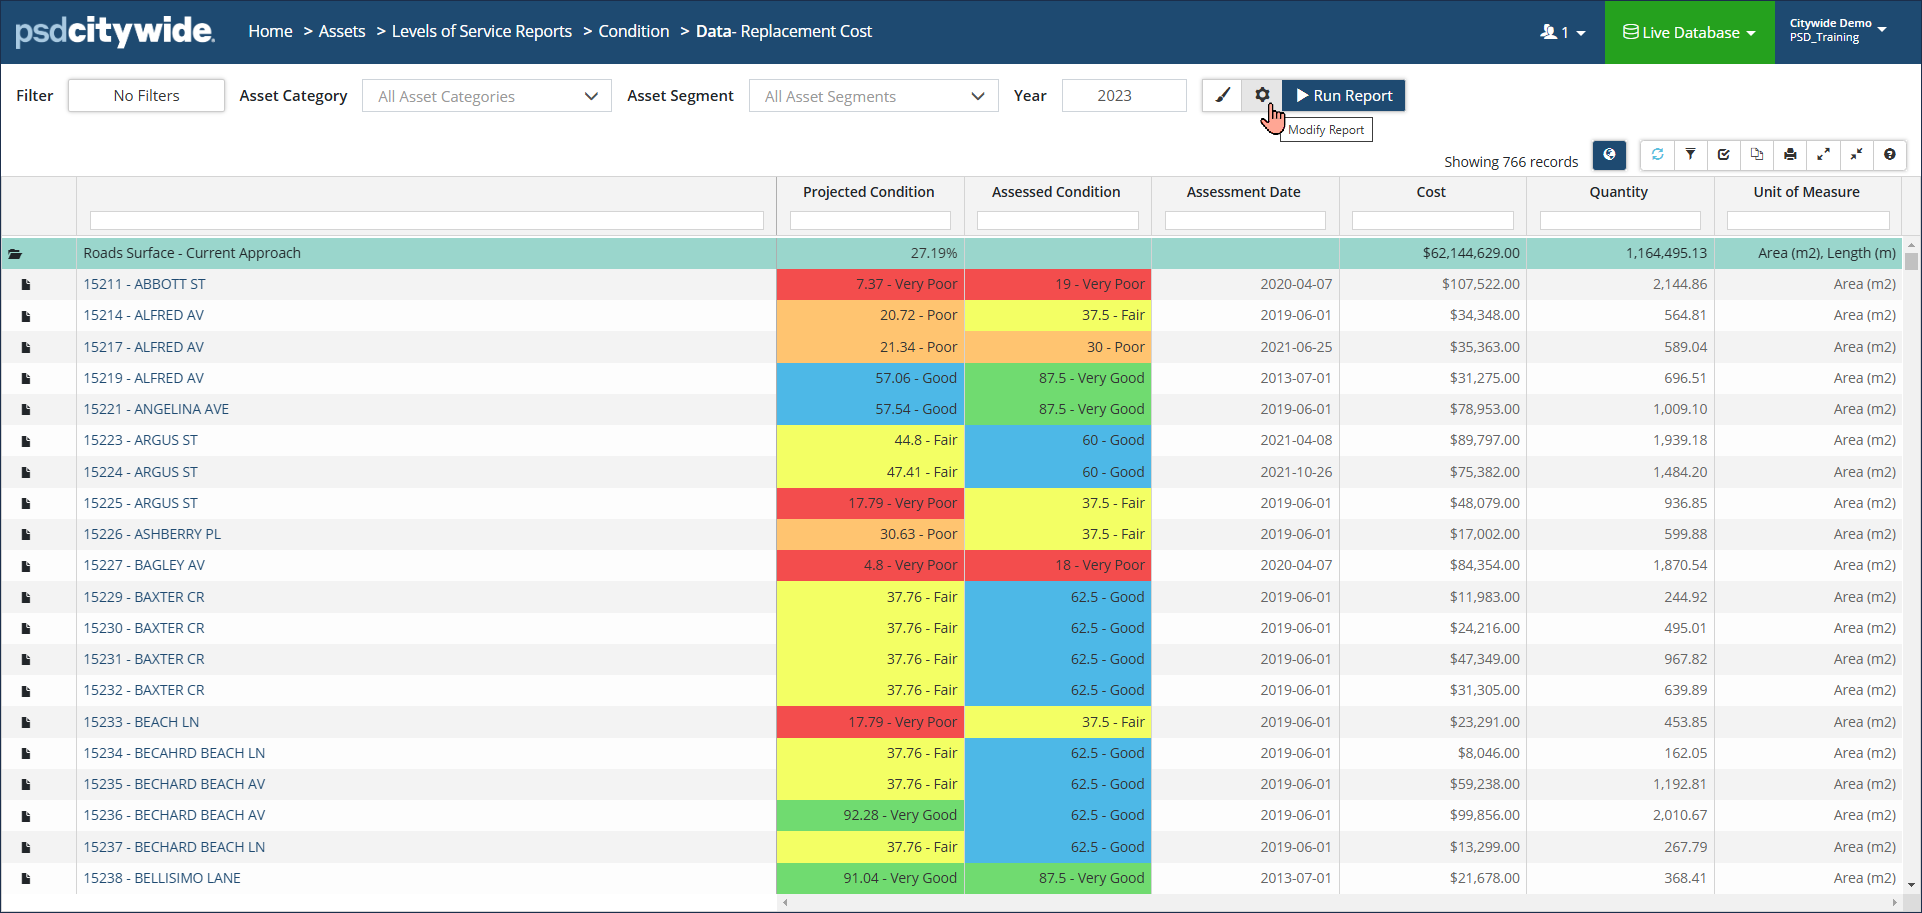
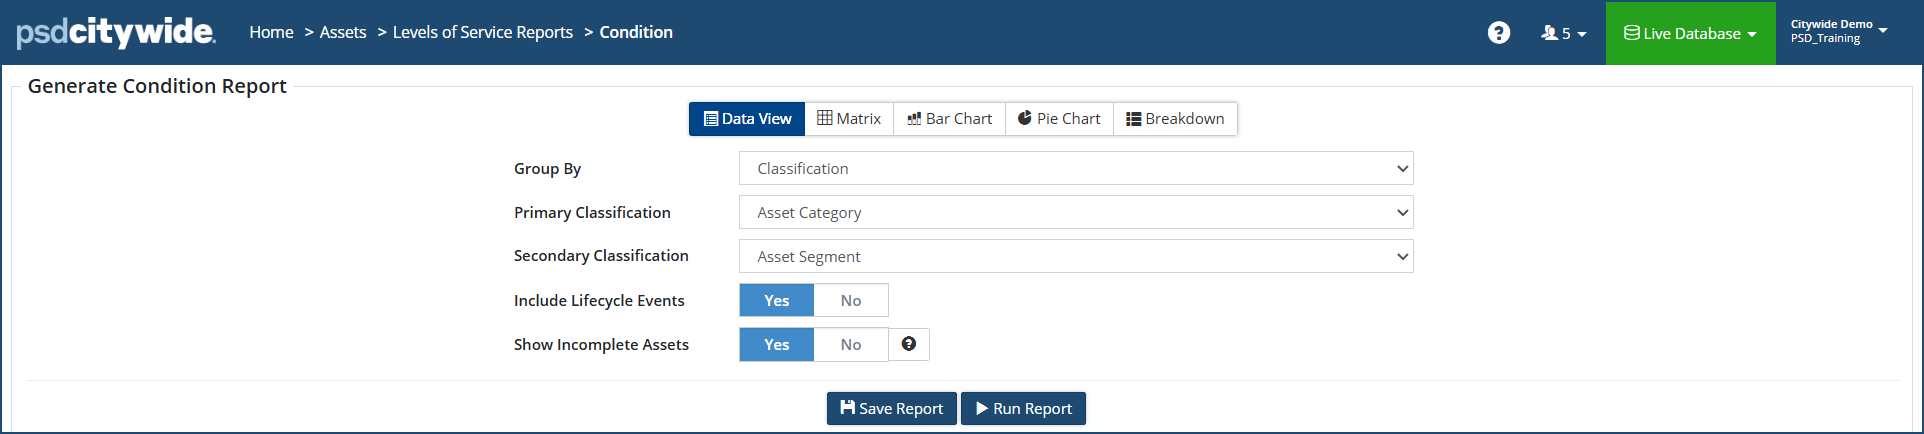
Data View: Classic report view showing the projected condition of assets, last condition assessment value and date, cost (replacement or historical, depending on settings), etc., for a reporting year. As well as Classification or Profile totals. Selection criteria settings include: ● Group By ● Primary Classification ● Secondary Classification ● Include Lifecycle Events ● Show Incomplete Assets
Click Modify Report settings to change the report options |
 |
|
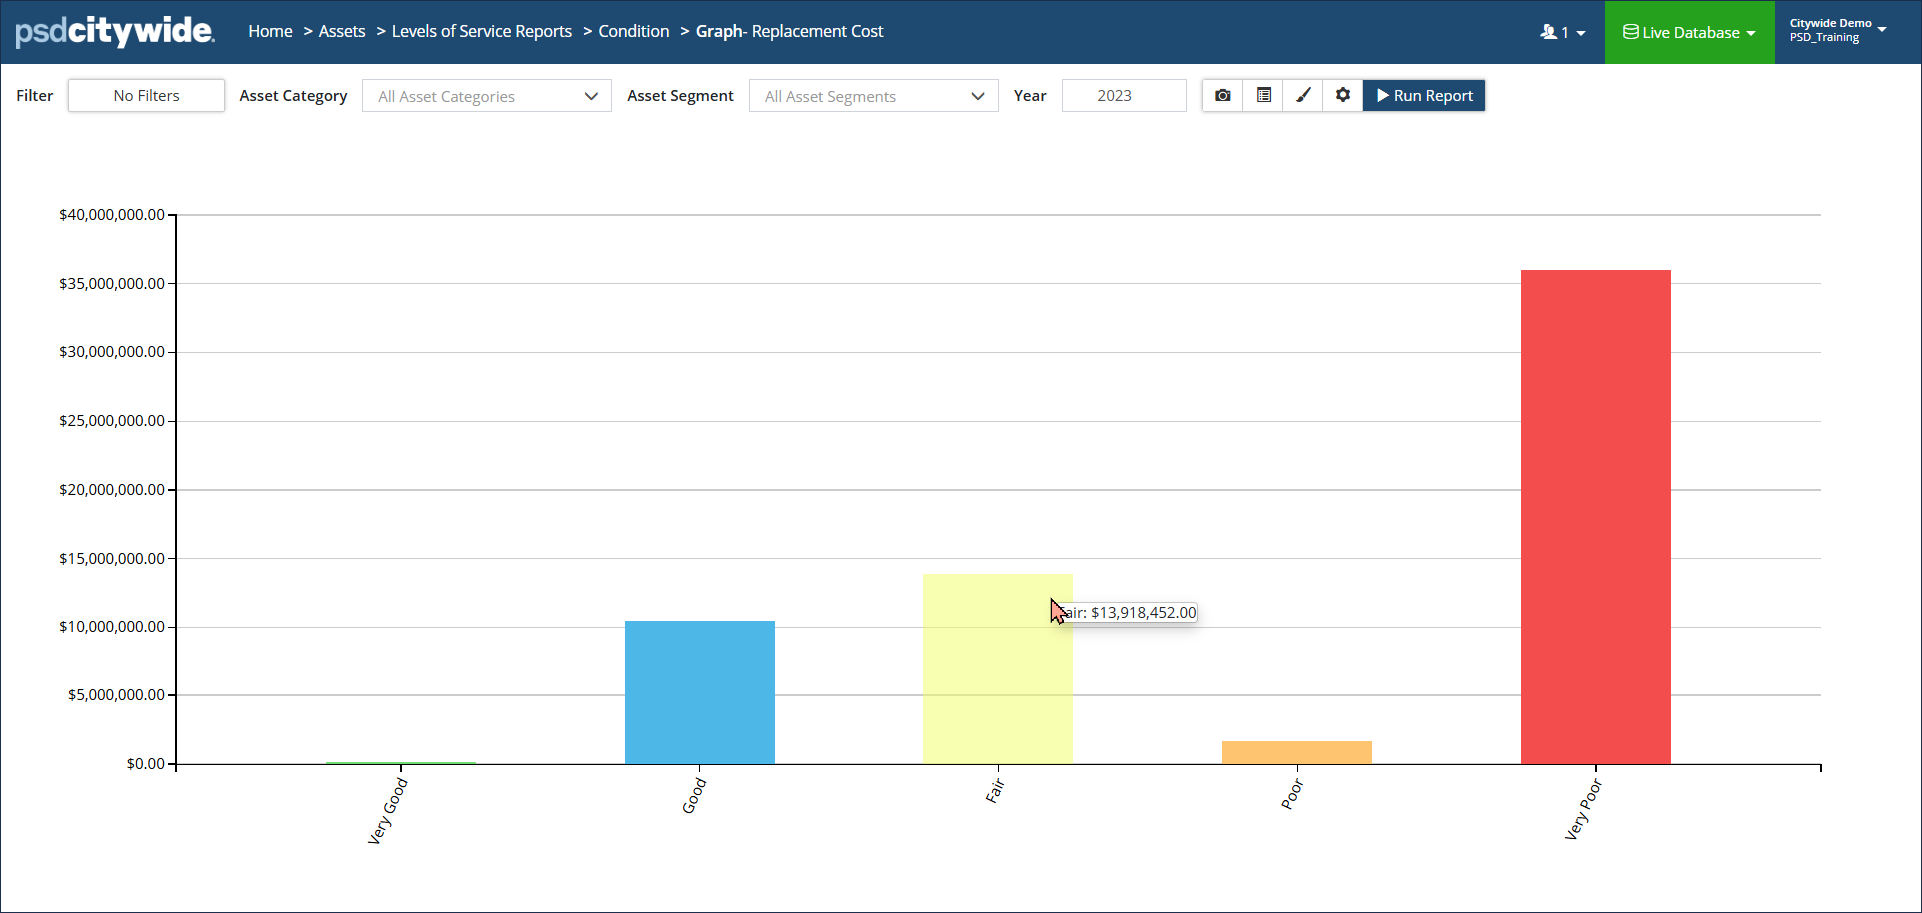
Bar Chart: Shows a total Cost or Quantity for each condition tier (from Very Good to Very Poor). Click Display options to format Labels or decimal places. Click Modify Report settings to change report options. |
 |
|
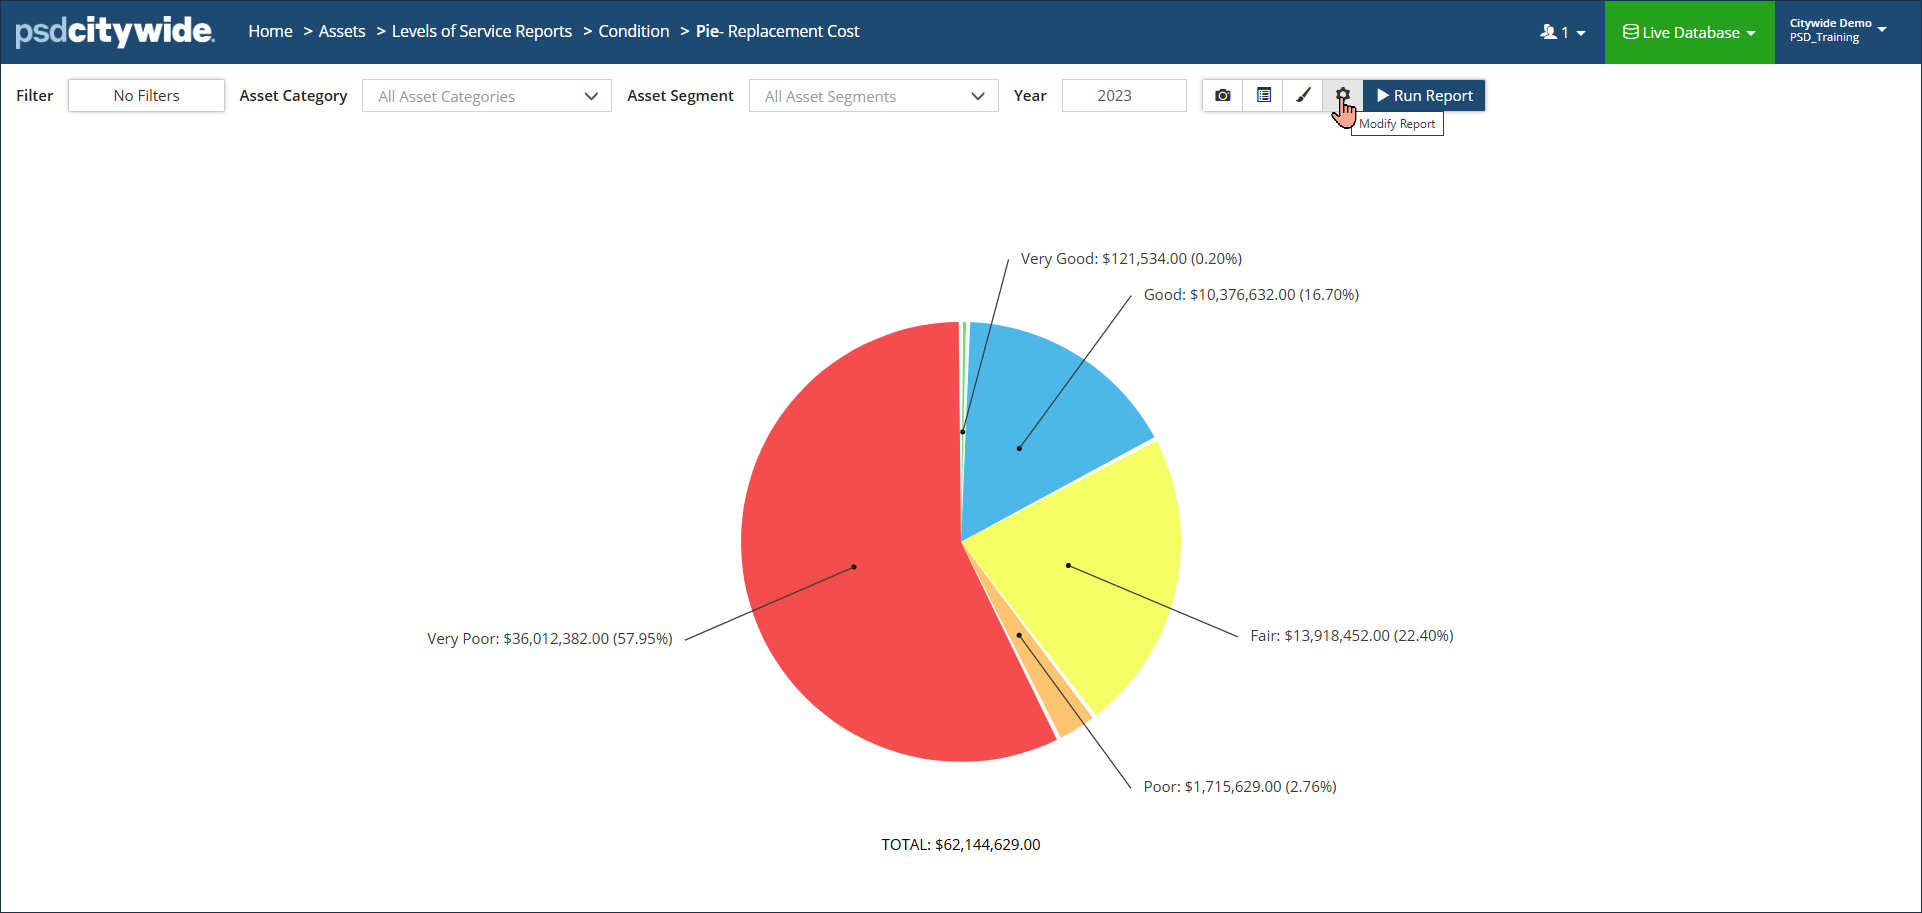
Pie Chart: Shows a total Cost or Quantity for each condition tier (from Very Good to Very Poor). Click Display options to format Labels or decimal places. |
 |
|
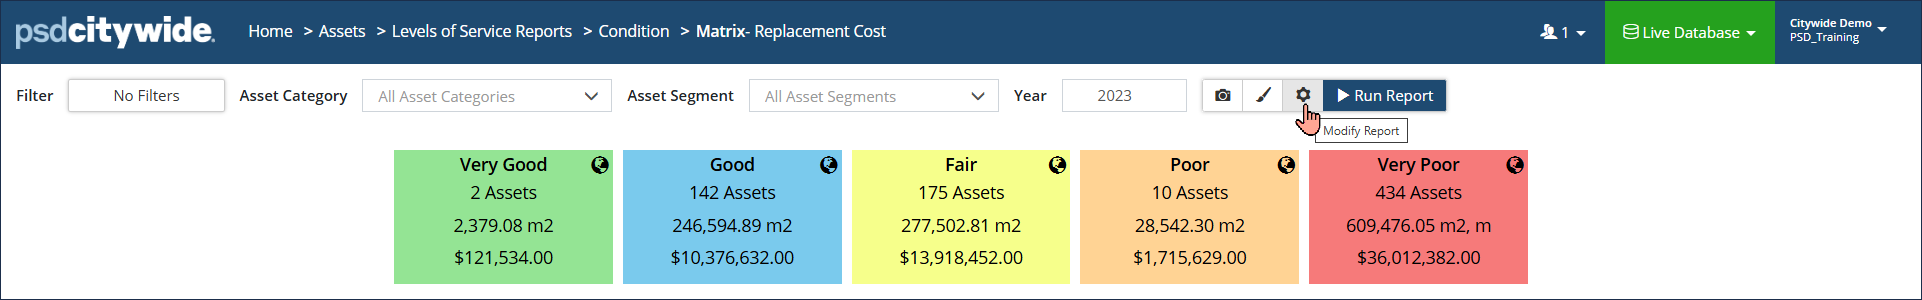
Matrix: Summarizes the total number of assets within each tier of the condition range (from Very Good to Very Poor). Additional totals include Adjusted Quantity and Cost. Click a block, to view the assets in the Inventory list view (e.g., click the red block to view assets in very poor condition). Click the map/globe icon on each block to view assets in GIS. |
 |
|
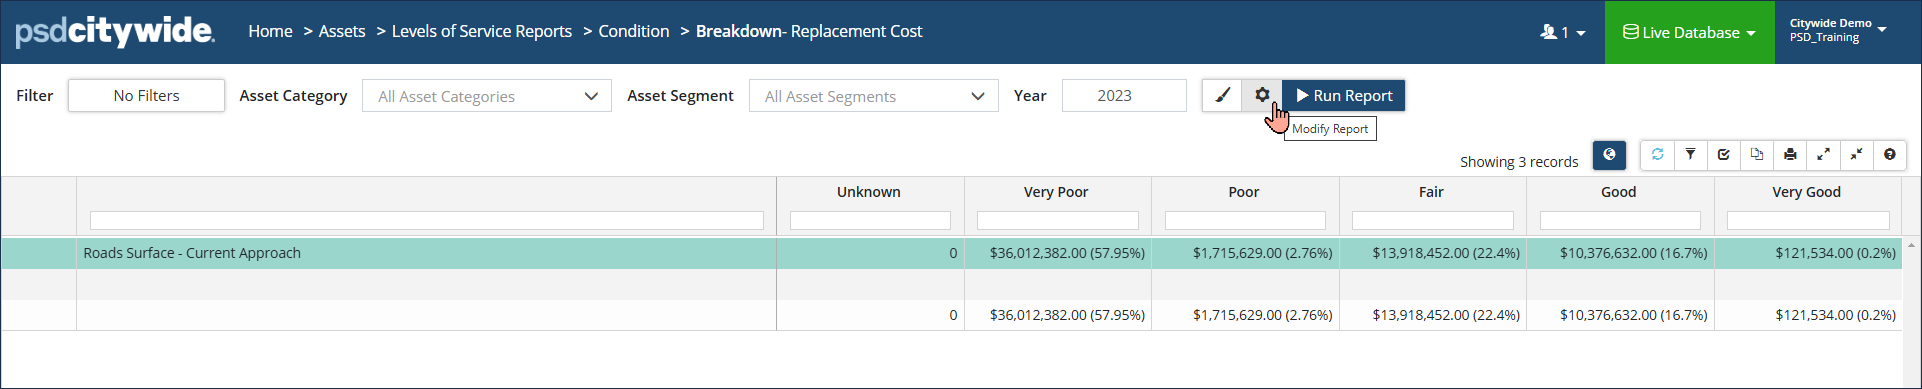
Breakdown: Shows a total Cost or Quantity for each condition tier (from Very Good to Very Poor). Click Modify Report options to 'show percent' which includes the total as a % of the whole. |
 |
Run a Condition Report
Step 1
- Select your report selection criteria: Classification or Profile
- Include Lifecycle Events: Yes or No
- Show Incomplete Assets: Yes or No (Incomplete assets are those missing an in-service date, replacement cost and/or estimated useful life.)
- Click 'Run Report'
Step 2
- Select your Filters as needed
- Enter the year
- Click Run Report
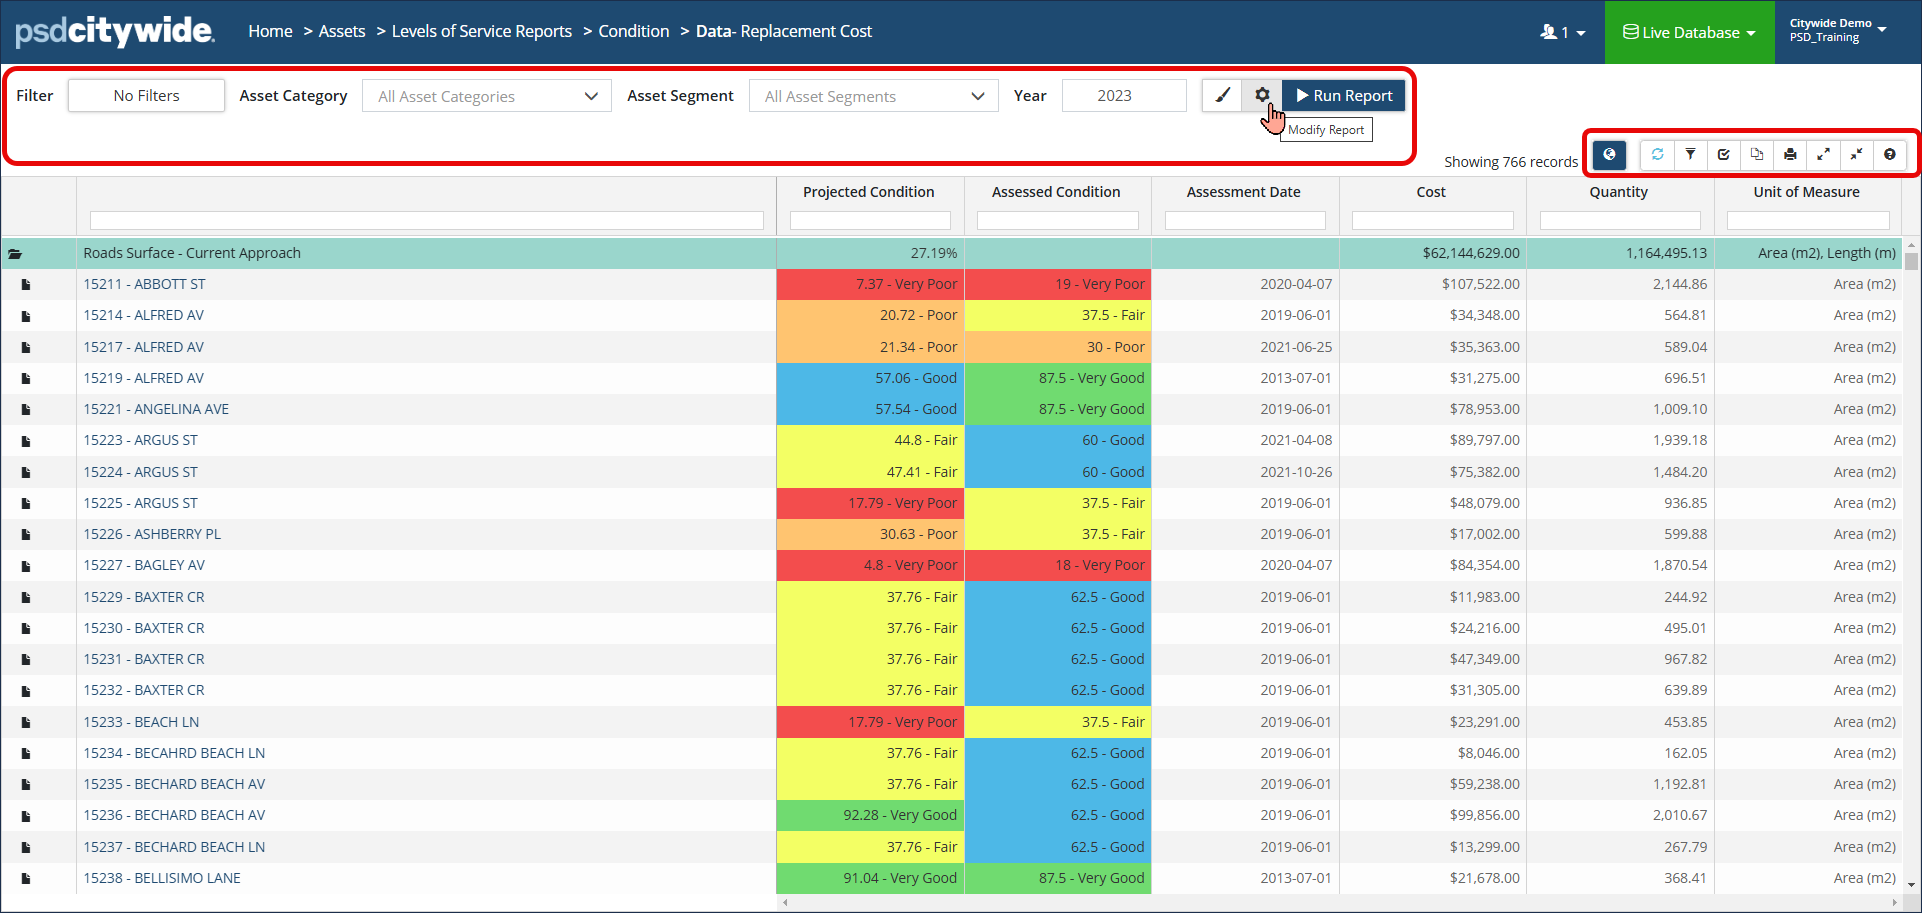
Click ![]() before or after generating the report to modify report options such as whether to Include Lifecycle Events, Show Incomplete Assets or what Costing option to pull into the report. The Event Start Year refers to the year in which lifecycle events begin to be scheduled. By default, the event start year is the same as the reporting year, or the opening year of a range, but can be changed.
before or after generating the report to modify report options such as whether to Include Lifecycle Events, Show Incomplete Assets or what Costing option to pull into the report. The Event Start Year refers to the year in which lifecycle events begin to be scheduled. By default, the event start year is the same as the reporting year, or the opening year of a range, but can be changed.