The Project ed Condition report is a multi-year report showing the Projected Condition of assets year after year. Projected condition will include the most recent condition assessment and can include Lifecycle events. Age-based condition is used if a condition assessment doesn’t exist. When Lifecycle events are included, the projected condition reflects condition assessment information and any lifecycle strategy events that impact the asset’s condition.
|
Report Type |
|
|
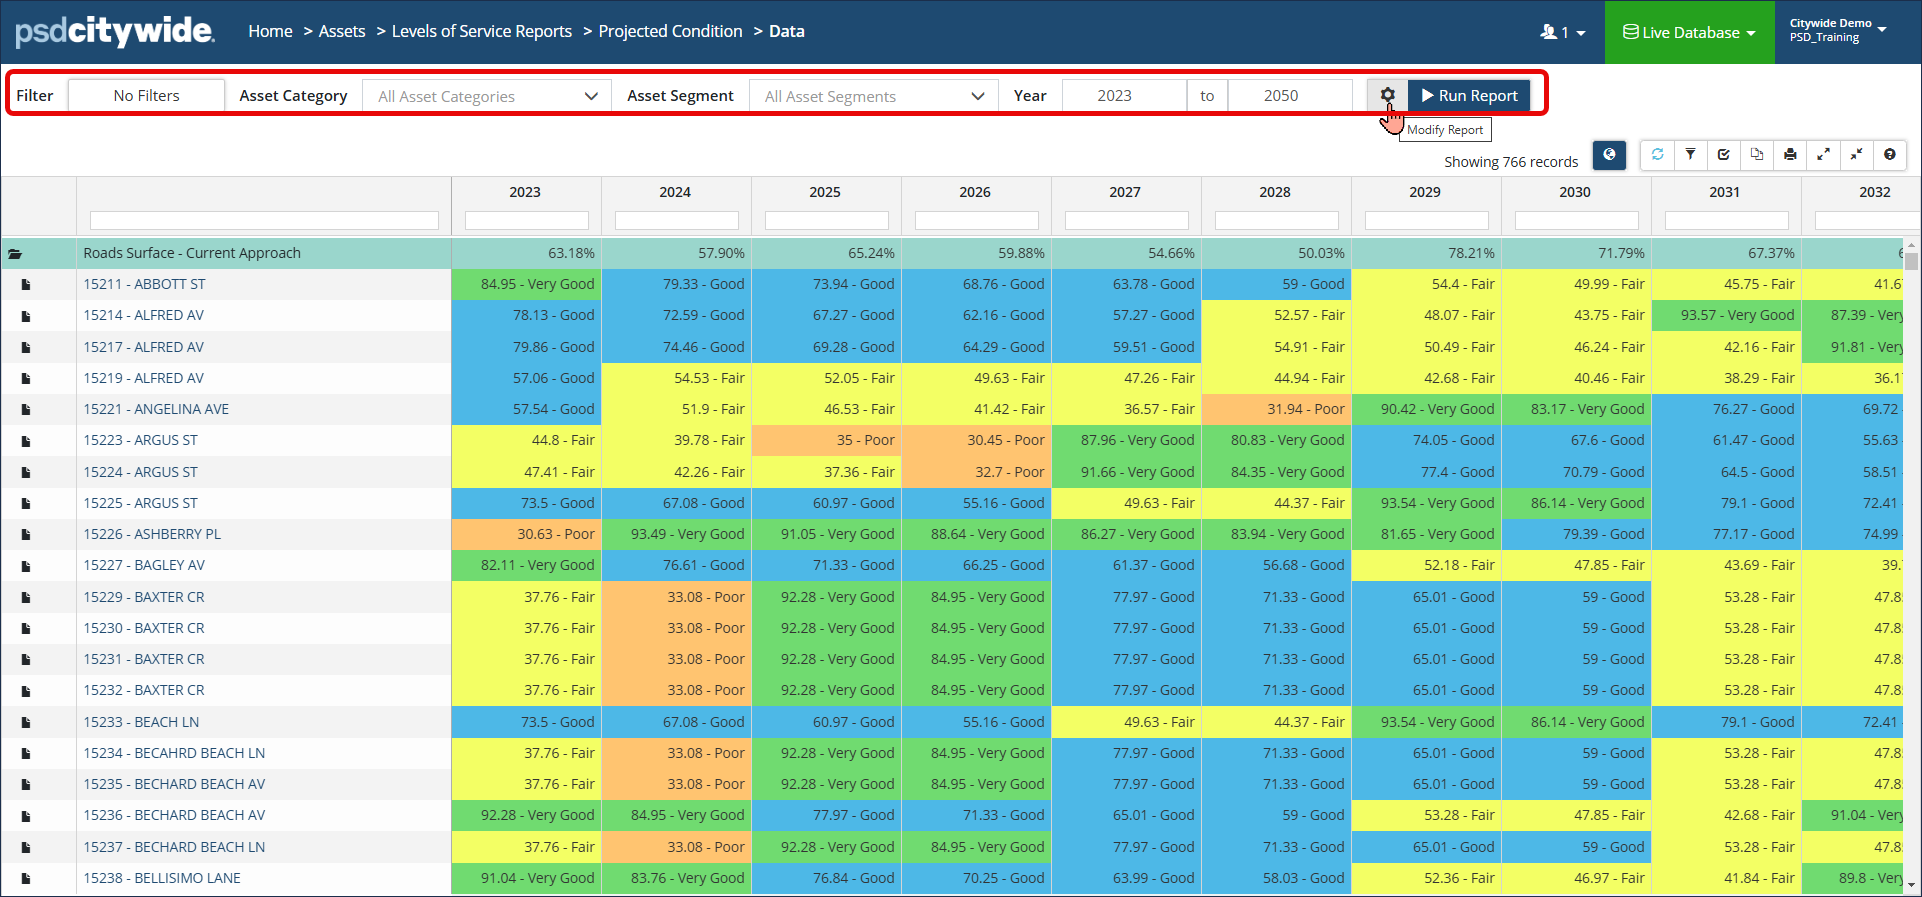
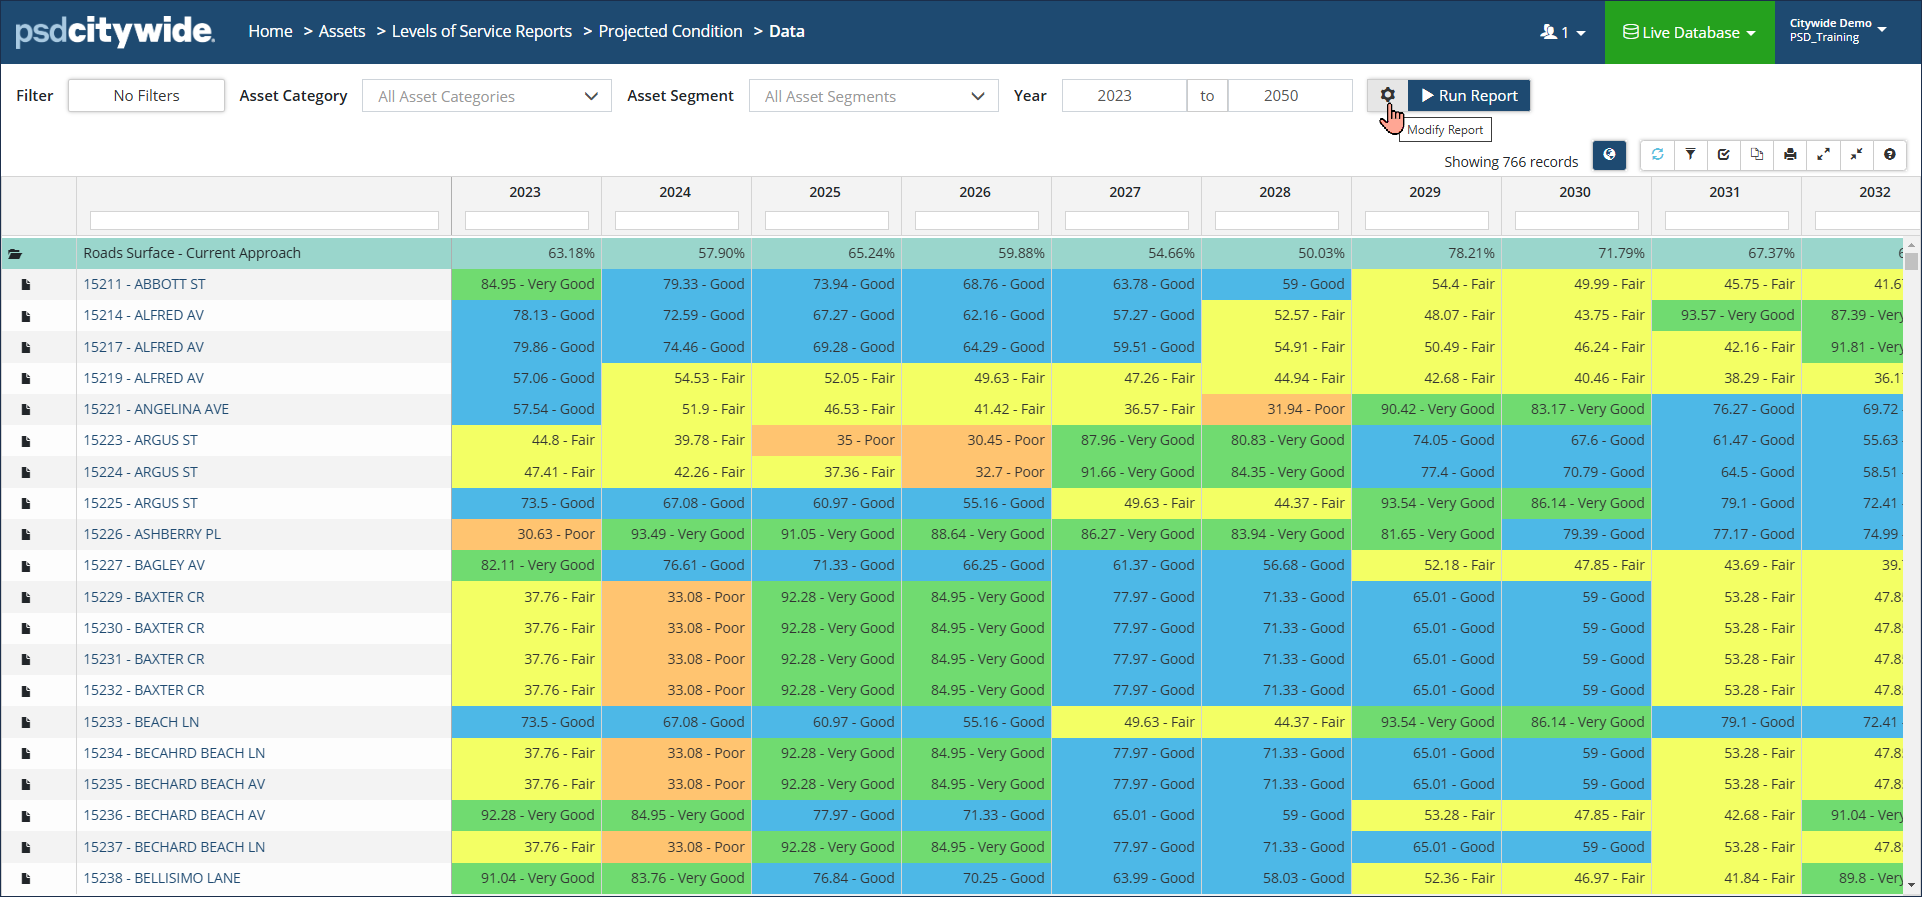
Data View: Classic report view showing how the projected condition of assets change year after year. Data can be grouped by Classification or by Profile. Click Modify Report settings to check/uncheck Assume Replacement and/or Include Lifecycle Events. Or to change the Strategy Method which defaults to Asset-end-of-life. Click the globe icon to view mapped assets in the GIS viewer. |
 |
|
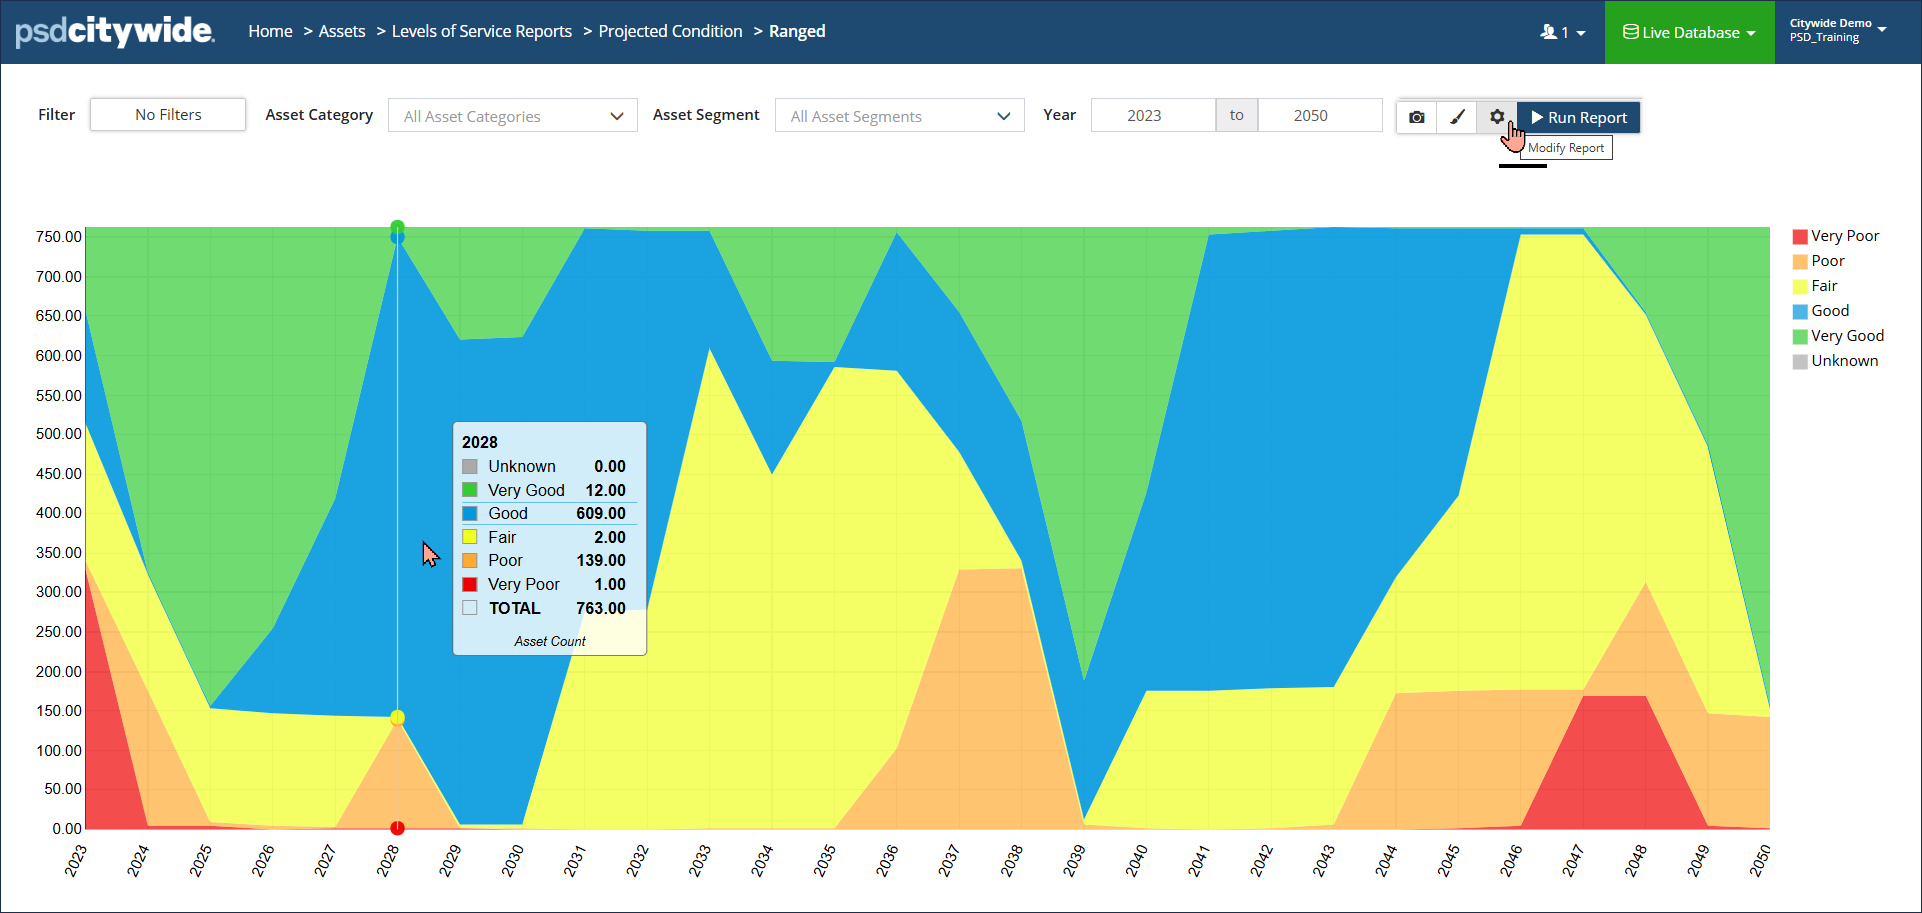
Ranged Area Chart: Colour-coded visualization showing how the distribution of condition ranges (from Very Good to Very Poor) changes over a defined range of years (x axis), based on the current Lifecyle events and strategies on the assets. Y-axis can measure Asset Count, Cost or Quantity. Hover over a data point to see a summary for the year. Click Display Options to add a Total or for additional formatting options. Click Modify Report settings to change Measure or Costing options. |
 |
|
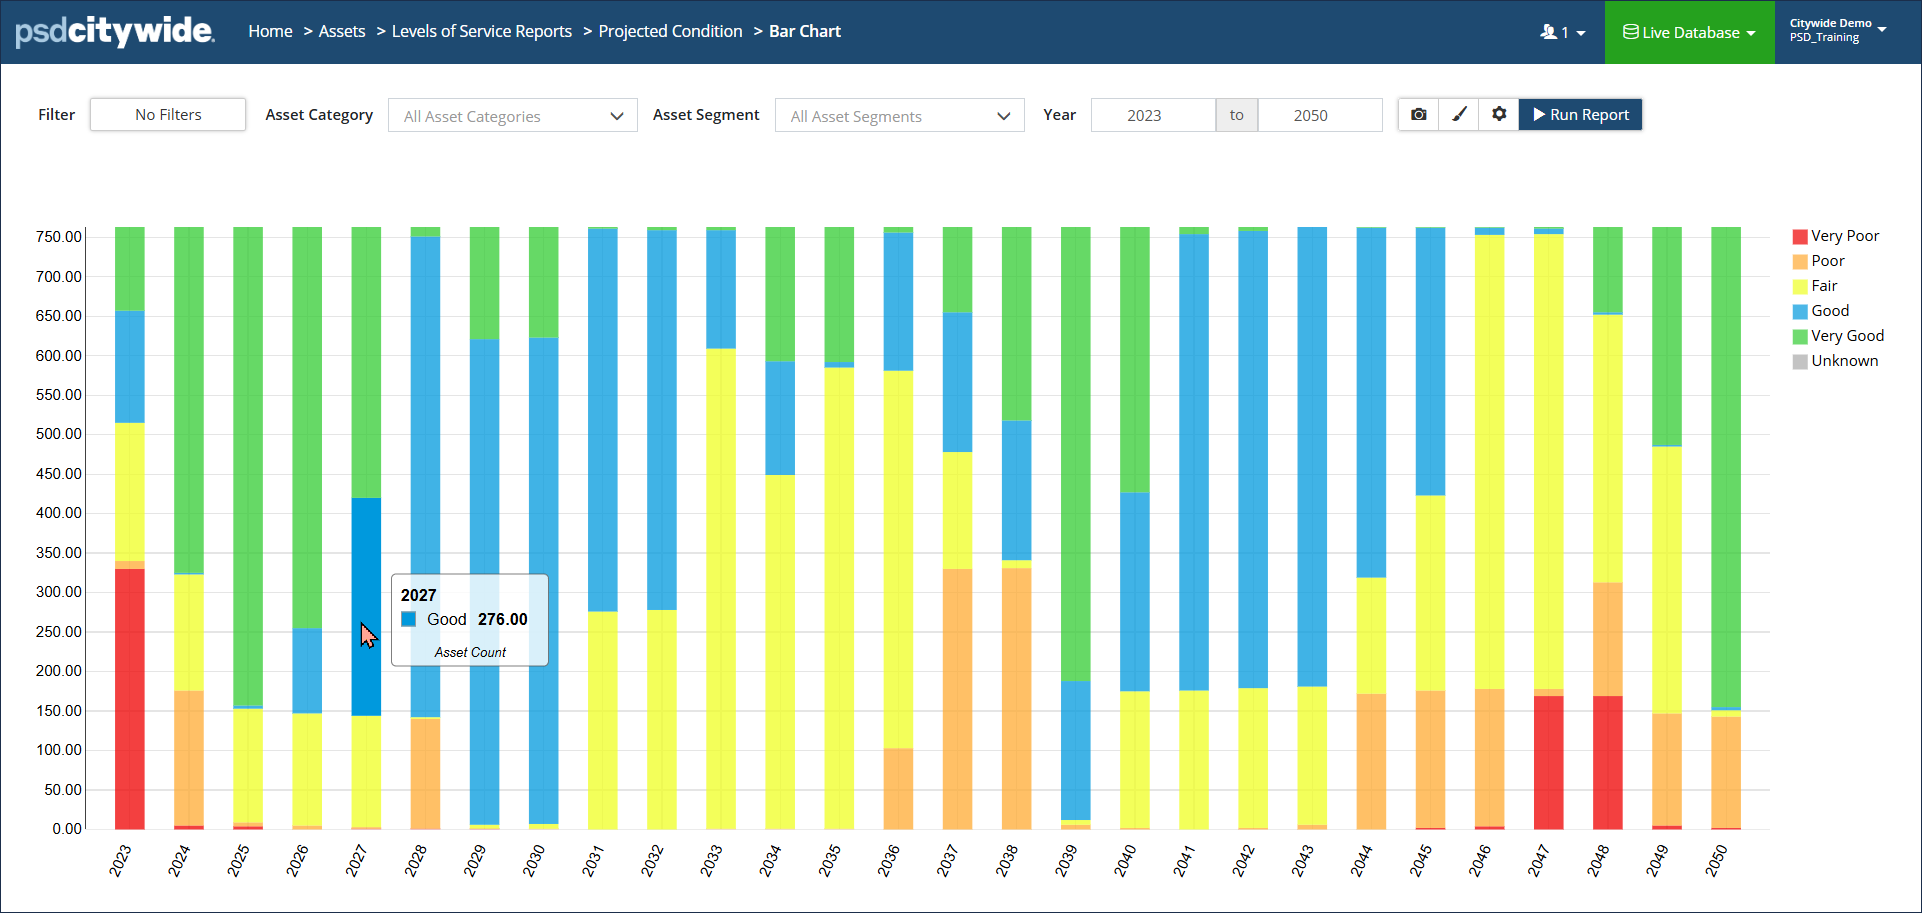
Bar Chart: Same as the Ranged Area Chart described above, but displays the data as stacked bar charts. |
 |
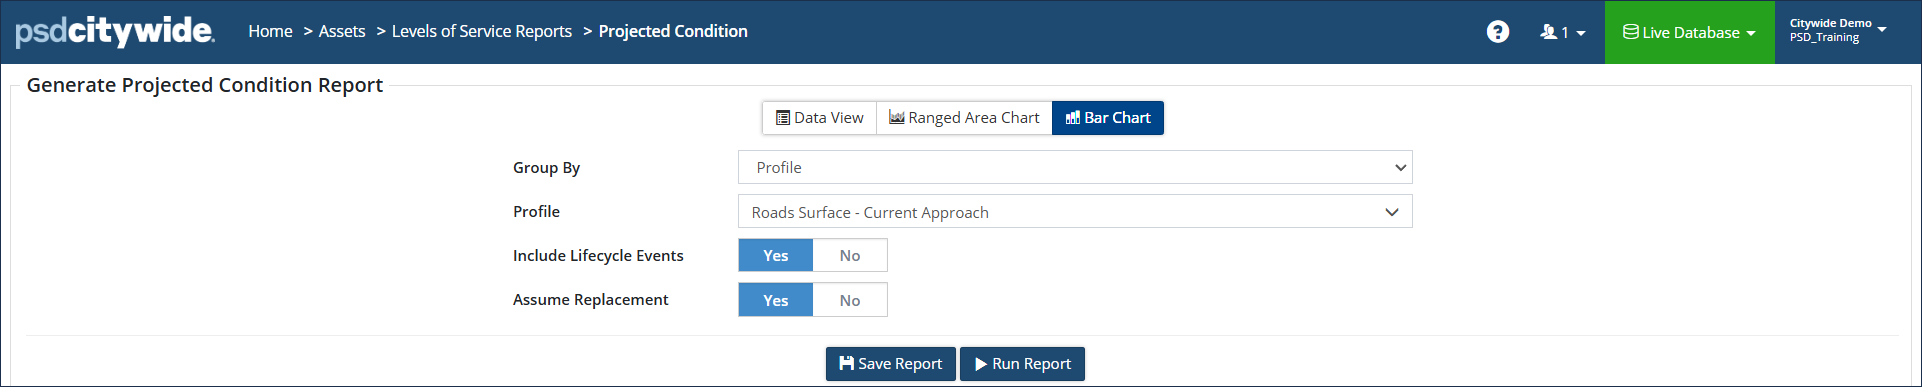
Run a Projected Condition Report
Step 1
- Select your report selection criteria: Classification or Profile
- Include Lifecycle Events: Yes or No
- Assume Replacement: Yes or No
- Click 'Run Report'
Step 2
- Select your Filters as needed
- Enter the year range
- Click Run Report
- (Optional: Once the report is generated, click Modify Report settings to change your initial selection criteria)