Comprehensive Financial and Asset Management reporting on your inventory assets is available through PSD Citywide’s Assets module. Reports can be generated for any reporting year, exported, and parameters can be saved for quick access.
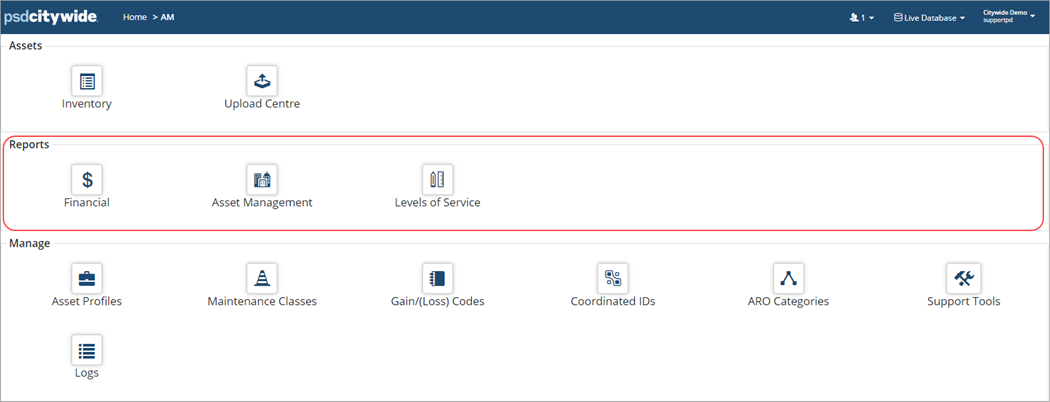
There are three categories of reports:
| Report Type | Description |
| Financial | PSAB compliant reports are found here including the Amortization, Transactions, and Financial Information Returns (FIR) reports. |
| Asset Management | These reports are used to support your Asset Management Plan which can include a financial strategy and/or lifecycle strategies that optimize the value of inventory assets. Some reports include Annual Requirement, Replacement Profile, and Replacement Cost. Reports within this category require a replacement cost to be calculated on the assets you would like included in the reports. Assets without a replacement cost are excluded from these reports. |
| Levels of Service | Levels of Service reports are used to support an Asset Management Plan and report on the condition, age, and risk of Inventory assets. Like Asset Management reports, levels of service reports require a replacement cost on the assets to be include in these reports. Reports include Condition/Projected Condition, Risk, Asset Age, etc. |
List of Reports
| Financial Reports | |
| Report Name | Description |
| Amortization | Reports on the Amortization schedule showing the depreciation of each asset for the year. |
| Transaction Report | Reports on adjustments (i.e., full/partial disposals, new acquisitions, additions, etc.) completed within Citywide for the reporting year. |
| Financial Returns | Generates FIR (Financial Information Return) reports required for the province of Ontario. To generate these reports assets must be assigned to the following classifications:
● Function/Subfunction (Schedule 51A and Schedule 74E) ● Schedule 51B Code (Schedules 51B and 51B – Construction in progress (formerly 51C)) |
| Projected Amortization | Reports on the projected Amortization schedule of assets within the reporting year. |
| Work In Progress | Reports on the Amortization schedule for WIP (Work in Progress) assets showing the depreciation for the year. |
| Water | Reports on the Amortization schedule for water assets showing the depreciation for the year. |
| Wastewater | Reports on the Amortization schedule for wastewater assets showing the depreciation for the year. |
| Contributed/Donated | Reports on the Amortization schedule for assets flagged as contributed/donated for the year. |
| Government Transfer | Reports on the Amortization schedule for assets flagged as Government transfers for a selected reporting year. |
| Contaminated | Reports on the Amortization schedule for assets flagged as contaminated for a selected reporting year. |
| Financial Exceptions | Runs a summary report showing asset Category and Segment detail grouped by Amortization Method, Estimated Useful Life, Units of Measure and/or Missing/Incorrect Data. This report can be used for data gap analysis. |
| Heritage | Reports on the Amortization schedule for assets flagged as heritage for a selected reporting year. |
| Leased | Reports on the Amortization schedule for assets flagged as leased for a selected reporting year. |
| CRV (Contact Citywide for access) | Reports on current replacement value (CRV) as required by the Ontario Ministry of Infrastructure. To generate this report assets must be assigned to the Function/Subfunction classifications. |
| ARO Accretion Report | Reports on assets that have been flagged as ARO Identified and shows opening/closing balances, accretion expense, etc. |
| ARO Status | Reports on the ARO status (i.e., Reviewed, Identified, Not Identified, Valuation Pending, or Not Reviewed) of the assets in your inventory. |
| Asset Management | |
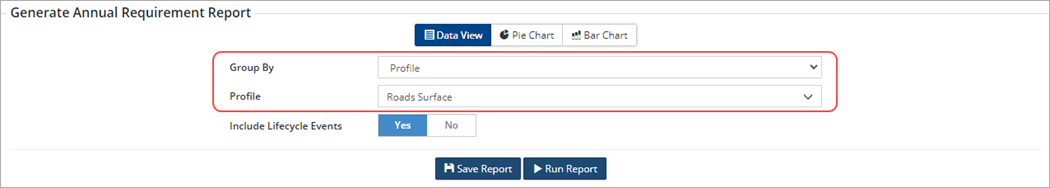
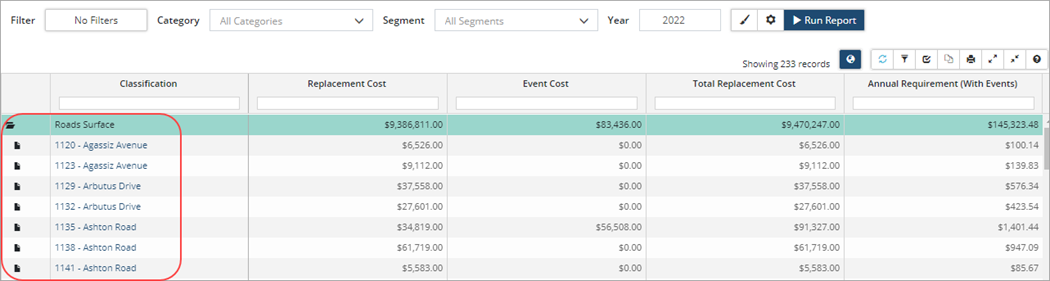
| Annual Requirement | Provides a summary of the annual $ requirement needed to maintain infrastructure. Can include Lifecycle events in this report. |
| Replacement Profile | Multi-year report identifying Capital cost projections. Useful when considering short, medium, and long-term Capital cost projections. This report also identifies a backlog of assets (i.e., assets that are still in use but have reached the end of their stated useful life). |
| Capital Replacement Profile | Same as the Replacement Profile report but filtered for Capital. |
| Operating Replacement Profile | Same as the Replacement Profile report but filtered for Operating. |
| Growth Replacement Profile | Same as the Replacement Profile report but filtered for Growth. |
| Coordinated IDs Report | Reports on assets grouped together using a Co-ordinated ID. |
| Lifecycle Deficiency / FCI | Provides a summary on which of the activities (lifecycle events in the asset profiles that have been applied to assets) are completed at the asset level. |
| Lifecycle Deficiency / FCI Event List | Provides a summary on which of the activities (lifecycle events in the asset profiles that have been applied to assets) are completed at the asset level. |
| Lifecycle Deficiency / FCI Matrix | Provides a matrix on which of the activities (lifecycle events in the asset profiles that have been applied to assets) are completed at the asset level. |
| Projected Lifecycle Deficiency / FCI | Provides a summary on which of the activities (lifecycle events in the asset profiles that have been applied to assets) are completed at the asset level. |
| Attribute Report | This report allows for analysis of data based on Attributes (i.e., material type, pipe diameter, etc.). |
| Installation Profile | Reports on the In-Service Date of assets for the reporting year. |
| Replacement Cost | Reports on the Replacement Cost or Total Replacement Cost (replacement cost plus events) of assets for the reporting year. |
| Dynamic Charts | Reports on data copied from an external source. For example, data in an Excel spreadsheet can be copied and pasted into the Data field. Citywide will then use this data along with the parameter settings on the right of the Data field to generate a pie chart. |
| Profile Exceptions | Reports on mismatched or incorrect data in the Inventory list. |
| Fuel & Cost Report | Reports on Fuel and Cost information entered if the Maintenance module is enabled. |
| Skipped Events | Summarizes assets that have skipped events for the reporting year. |
| Insurance/Warranty/Lease | Reports on Insurance/Warranty/Lease data collected at the asset level. Three report types are available. |
| Levels of Service | |
| Condition | Reports on the projected condition of the asset. Citywide takes the assessed condition and projects it from the assessment date to the end of the reporting year. If a condition assessment does not exist the report will use an age-based condition. |
| Projected Condition | Reports on the projected condition rating of assets. |
| Condition Assessment Log | Reports on the assessed condition of the asset. |
| Risk | Reports on the Risk rating of assets. |
| Projected Risk | Reports on the Projected risk rating of assets. |
| Asset Age | Reports on the age and remaining useful life using either the financial age information or the most recent condition assessment. |
| Averages Reports | Reports on the average of several Lifecycle fields such as, the average Service Life. |
| Replacement Cost Log | Multi-year report showing the most recently archived Replacement Costs in each year along with their date. |
Definition of Terms
| Term | Definition |
| Expandable | Used to define the level of detail in a report. When set to Yes users can drill down to the asset level by clicking on the folder icons. |
| Include Lifecycle Events | Used in Asset Management and Levels of Service reporting. Report output shows how the asset management strategy, found in the asset Profile, impacts assets for the reporting year. When set to Yes, all lifecycle strategy events including asset replacement events are included in the report. To report only on replacement events, set the flag to No. |
| Assume Replacement | Used in Asset Management and Levels of Service reporting and when set to Yes, will assume a new iteration of the asset and apply the lifecycle strategy again. When set to No, the report only applies the lifecycle events once, and does not repeat the event cycle after replacement. |
| Strategy Method | Used in Asset Management and Levels of Service reporting, and refers to the asset’s first replacement. There are two options to choose from. The Asset end-of-life method is based on its original EUL, modified by adjustments and condition assessments. Afterwards, Lifecycle EUL is used for future iterations. The Lifecycle EUL method can be used to force the asset’s first replacement to be based off its Lifecycle EUL. |
| Event Start Year | Available in Levels of Service reports and refers to the first year in which lifecycle events are scheduled and applied. By default, the event start year is the same as the reporting year, or the opening year of a range but it can be modified independently. |
| Funding Source | Available in Asset Management and Levels of Service reporting and is used to filter the output to include Capital, Operating, and/or Growth lifecycle events. By default, most reports will include all funding sources. |
| Backlog | Calculates the replacement cost of assets that have reached the end of their EUL by the reporting year (or opening year of a range) and have not been replaced. |
| Adjusted Event Costs | Available as a setting in the Annual Requirement and Replacement Cost reports. When in use, event costs will be substituted with costs from scheduled lifecycle events when applicable. Non-strategy and skipped events will not have an impact on the requirement’s EUL or Lifecycle EUL divisor. |
Generate a Report
For most reports, regardless of category, the Generate Report screen is the first screen you’ll work with when running a report. Here is where you would select the Report Type, specify how data is to be aggregated (or grouped) within the report, as well as Save report settings.
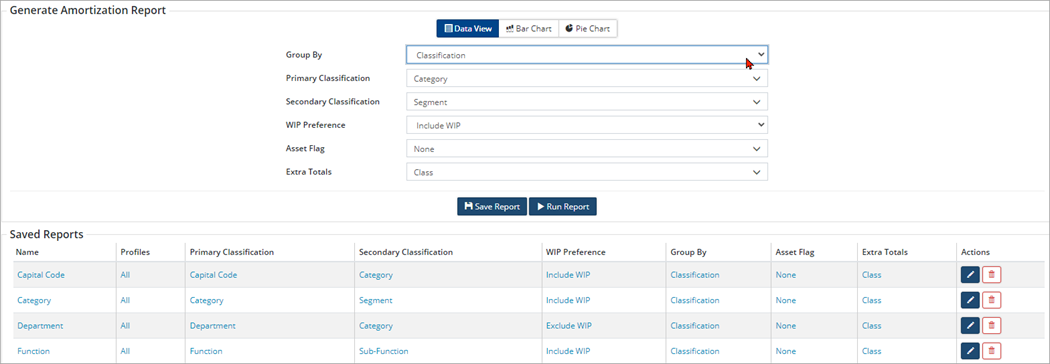
Options will vary depending on the report selected but common settings include:
Report Type: Data View, Bar/Pie Chart or Matrix
Group By: How data will be aggregated in the report output. You can either select assets to report on by Classification or by Asset Profile. When Group by Classification, is selected all classifications within your database (Home 🡆 Administration 🡆 Classifications) become available in the Primary/Secondary drop-down list fields. In the scenarios below, water assets are being reported on by Classification. Report 1 shows water assets aggregated by Category/Segment whereas Report 2, shows the same water assets but grouped by Department and then Category/Segment.
Report 1: Shows all Water Services assets grouped by Category (Water)/Segment (All Segments). Subtotals are calculated for the Water Services category, as well as for each corresponding segment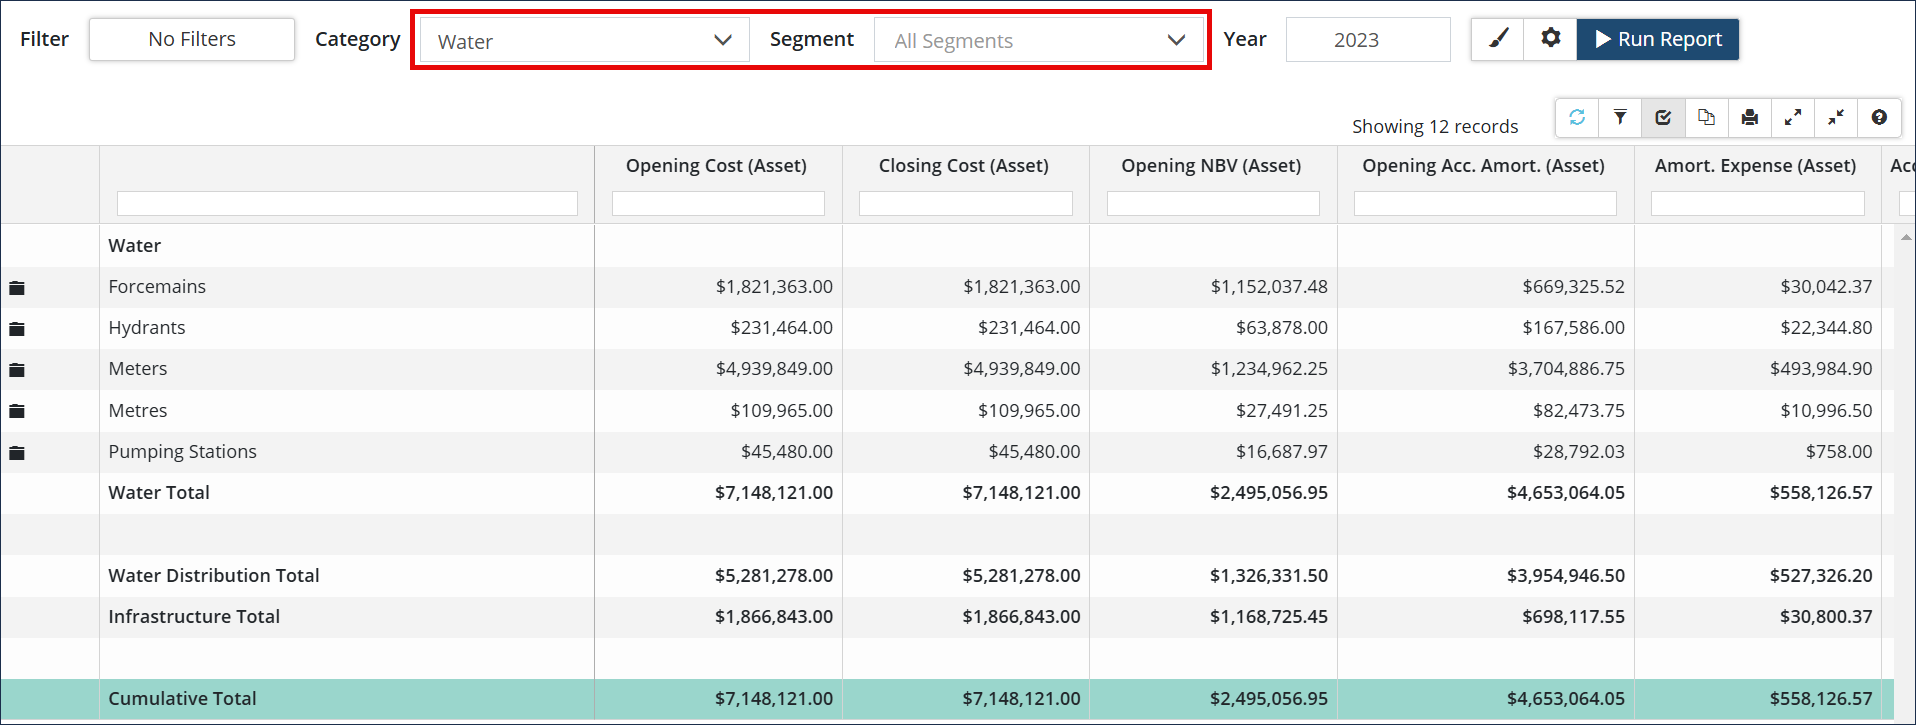
Report 2: Shows all Water assets grouped by Department (Public Works)/Category (Water). Subtotals are calculated for the Water department, as well as for each Water Services segment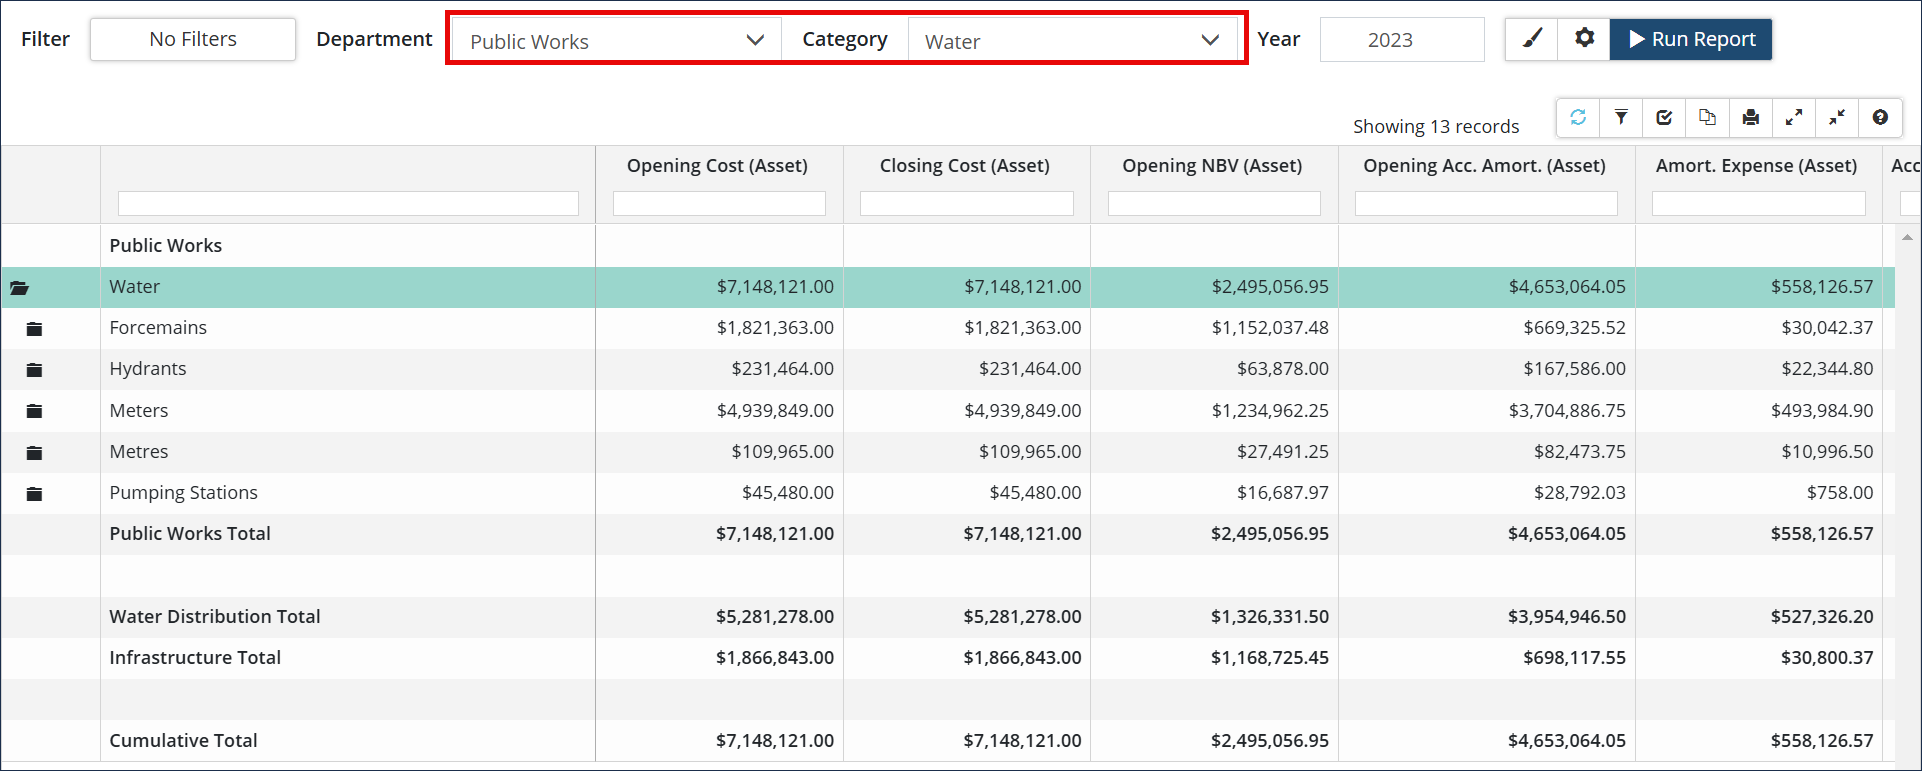
Most reports also provide the option to group by Profile.
Step 1
Step 2
Save Custom Report Settings
Report selections/settings can be saved for future access. To save report settings:
Select a report.
Select a report type and then select options from the dropdown lists as needed. Report types include:
- Data View generates a table of data that can easily be exported to Excel.
- Bar Chart generates visual charts that can be exported as a .png or .jpg image file.
- Pie Chart generates visual charts that can be exported as a .png or .jpg image file.
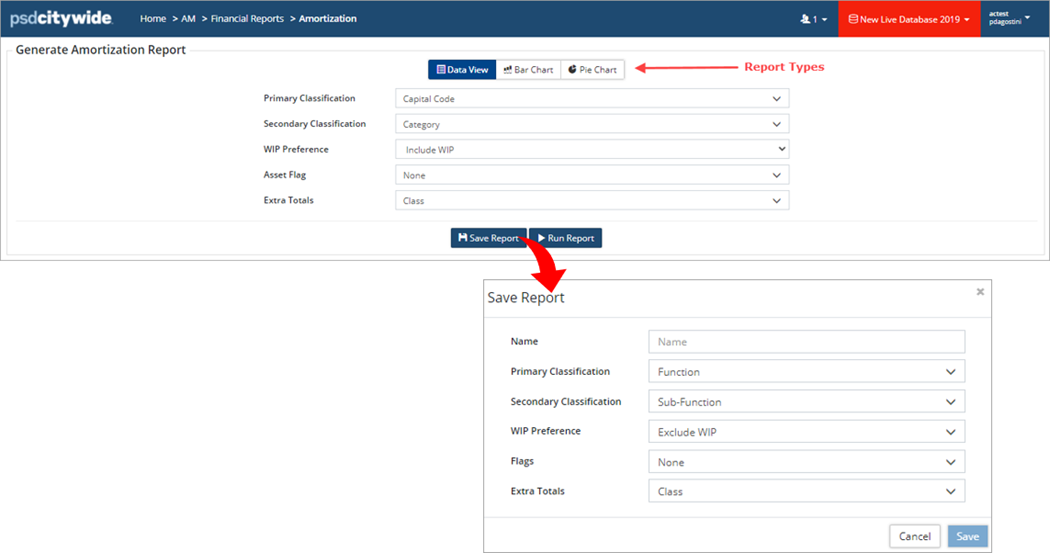
- Click Save Report.
- In the Save Report form enter a Name and review all settings.
- Click Save. Once saved, the new custom report is added to the Saved Reports table at the bottom.
Report Options
| Option | Description |
| Filter | This option initially reads No Filters and is used to narrow the scope of the assets collected in the report by a Classification or Coordinated ID. For example, you may want a report where the data is grouped by Category and Segment but only includes assets tagged with a specific Capital Code or Coordinated ID. Once a filter(s) has been set the button will read # Filters. |
| Display Options |
Used to change formatting within a report. Options will vary depending on the report type and may include:
Default formatting options such as decimal places, font size, and colour theme can be set in Preferences (Home 🡆 Administration 🡆 Preferences). |
|
Modify Reports |
Used to modify the data output. Options will vary depending on the report type and includes the following:
Financial Reports:
Asset Management and Levels of Service Reports
|
|
Export Chart |
Used to export and save the chart as a PNG or JPG file. |
|
Show in Inventory |
Used to navigate to the Inventory List. The list view will be filtered to show the assets that are being reported on. |
|
View Date in GIS |
Used to view mapped assets in the GIS viewer. |
Grid Options
| Option | Description |
| |
Used to refresh the grid. |
| |
Clears all applied filters. |
| |
Used to display/hide columns of information within the grid. |
| |
Export the report to Excel. |
| |
Export the report to PDF. |
| |
Used to expand all folders within the report and show individual assets. When folders are expanded users can drill down to the asset level by clicking on the asset ID and name. |
| Used to collapse all folders within the report and hide the assets. | |
| |
Provides tips and examples on filtering and sorting within the grid. |